
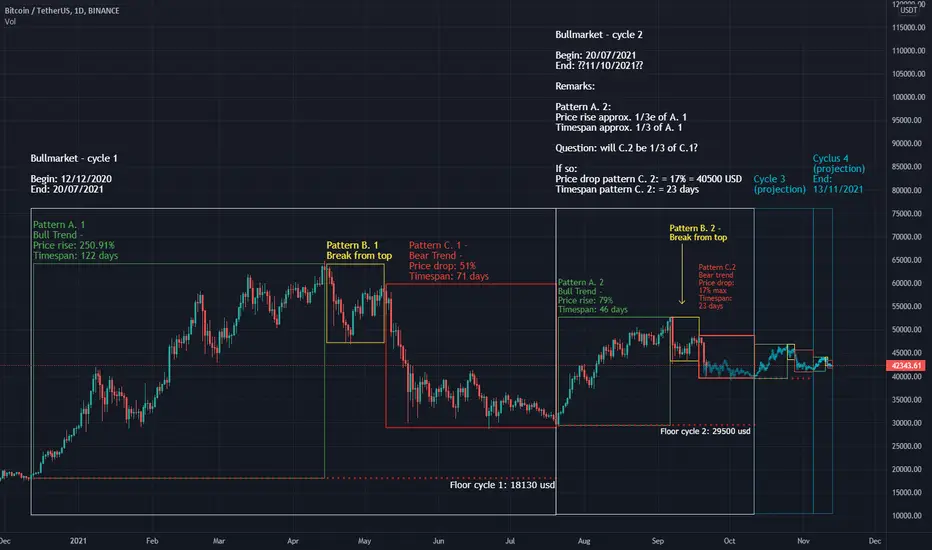
This analysis highlights the patterns that repeat on the daily BTC-USDT chart, and projects what were to happen if these patterns were to keep repeating.
It shows the emergence of a symmetrical wedge.
This leads to a second chart, illustrating the symmetrical wedge poised for breakout second half of November to a top of 90.000 USD / BTC. It is linked as a related idea.
It shows the emergence of a symmetrical wedge.
This leads to a second chart, illustrating the symmetrical wedge poised for breakout second half of November to a top of 90.000 USD / BTC. It is linked as a related idea.

คำจำกัดสิทธิ์ความรับผิดชอบ
ข้อมูลและบทความไม่ได้มีวัตถุประสงค์เพื่อก่อให้เกิดกิจกรรมทางการเงิน, การลงทุน, การซื้อขาย, ข้อเสนอแนะ หรือคำแนะนำประเภทอื่น ๆ ที่ให้หรือรับรองโดย TradingView อ่านเพิ่มเติมใน ข้อกำหนดการใช้งาน
คำจำกัดสิทธิ์ความรับผิดชอบ
ข้อมูลและบทความไม่ได้มีวัตถุประสงค์เพื่อก่อให้เกิดกิจกรรมทางการเงิน, การลงทุน, การซื้อขาย, ข้อเสนอแนะ หรือคำแนะนำประเภทอื่น ๆ ที่ให้หรือรับรองโดย TradingView อ่านเพิ่มเติมใน ข้อกำหนดการใช้งาน