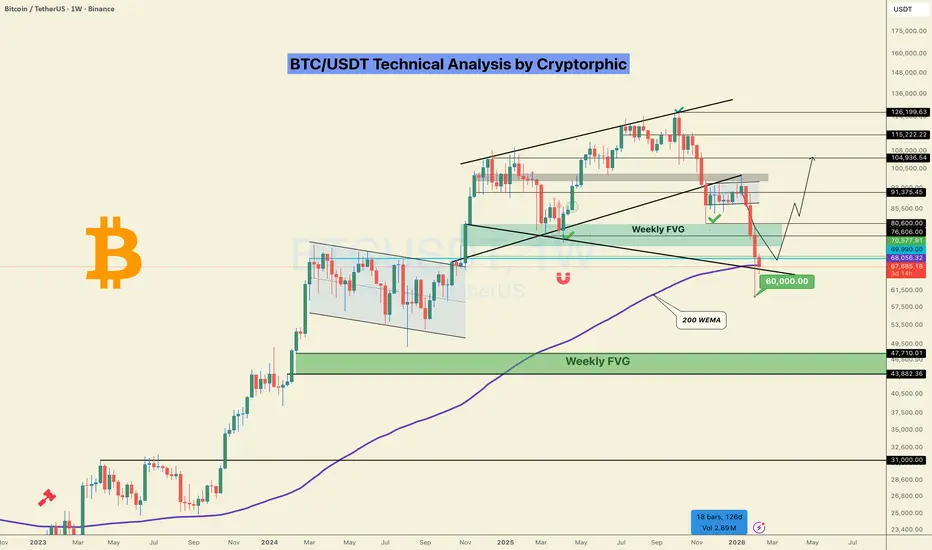
Bitcoin has broken down from the rising channel and is now sitting on a major confluence zone: weekly FVG and 200-week EMA around 70K–76K. This is a critical demand area.
Key levels
Support: 60K – 66.5K
Invalidation: weekly close below 66.5K
Recent weekly candles show aggressive sell-side expansion into long-term support. We saw a strong impulsive red candle breaking structure, followed by long lower wicks below 70K, showing buying absorption. The latest candle is sitting on the 200-WEMA, suggesting selling pressure is slowing.
The price might just be forming a higher-timeframe base here before the next impulsive move.
A breakdown below 66K would open the door to the next weekly FVG at 43K–48K.
Bias
This looks like a higher-timeframe correction, not a bear market. Smart money typically accumulates in this zone.
If you find this helpful , follow me and please hit the like button.
Do share your views in the comments.
Thank you
PEACE
Key levels
Support: 60K – 66.5K
Invalidation: weekly close below 66.5K
Recent weekly candles show aggressive sell-side expansion into long-term support. We saw a strong impulsive red candle breaking structure, followed by long lower wicks below 70K, showing buying absorption. The latest candle is sitting on the 200-WEMA, suggesting selling pressure is slowing.
The price might just be forming a higher-timeframe base here before the next impulsive move.
A breakdown below 66K would open the door to the next weekly FVG at 43K–48K.
Bias
This looks like a higher-timeframe correction, not a bear market. Smart money typically accumulates in this zone.
If you find this helpful , follow me and please hit the like button.
Do share your views in the comments.
Thank you
PEACE
การซื้อขายยังคงดำเนินอยู่
 BTC Weekly Update
No major structural change yet, Bitcoin is still holding the same weekly demand zone around the 200W EMA / FVG that we highlighted earlier.
After the sharp sell-off, price is now stabilizing and compressing near support, showing that buyers are still defending this area. The move so far looks like continuation of the higher-timeframe correction and base-building phase, not a fresh breakdown.
As long as BTC stays above the mid-60K region, this remains a consolidation at support.
Now the key is the weekly candle close, that will tell us if BTC is building a base or preparing for another move.
What do you think happens next?
Share your thoughts in the comments 👇
#BTC #Bitcoin

Daily Signals:- telegram.me/thecryptorphic
My Fav BITUNIX: bitunix.com/register?vipCode=Cryptorphic
Weex $2000: bit.ly/Weex2026
TOOBIT: toobit.com/t/Cryptorphic
ELITES: bit.ly/Join_elite
My Fav BITUNIX: bitunix.com/register?vipCode=Cryptorphic
Weex $2000: bit.ly/Weex2026
TOOBIT: toobit.com/t/Cryptorphic
ELITES: bit.ly/Join_elite
การนำเสนอที่เกี่ยวข้อง
คำจำกัดสิทธิ์ความรับผิดชอบ
ข้อมูลและบทความไม่ได้มีวัตถุประสงค์เพื่อก่อให้เกิดกิจกรรมทางการเงิน, การลงทุน, การซื้อขาย, ข้อเสนอแนะ หรือคำแนะนำประเภทอื่น ๆ ที่ให้หรือรับรองโดย TradingView อ่านเพิ่มเติมใน ข้อกำหนดการใช้งาน
Daily Signals:- telegram.me/thecryptorphic
My Fav BITUNIX: bitunix.com/register?vipCode=Cryptorphic
Weex $2000: bit.ly/Weex2026
TOOBIT: toobit.com/t/Cryptorphic
ELITES: bit.ly/Join_elite
My Fav BITUNIX: bitunix.com/register?vipCode=Cryptorphic
Weex $2000: bit.ly/Weex2026
TOOBIT: toobit.com/t/Cryptorphic
ELITES: bit.ly/Join_elite
การนำเสนอที่เกี่ยวข้อง
คำจำกัดสิทธิ์ความรับผิดชอบ
ข้อมูลและบทความไม่ได้มีวัตถุประสงค์เพื่อก่อให้เกิดกิจกรรมทางการเงิน, การลงทุน, การซื้อขาย, ข้อเสนอแนะ หรือคำแนะนำประเภทอื่น ๆ ที่ให้หรือรับรองโดย TradingView อ่านเพิ่มเติมใน ข้อกำหนดการใช้งาน