
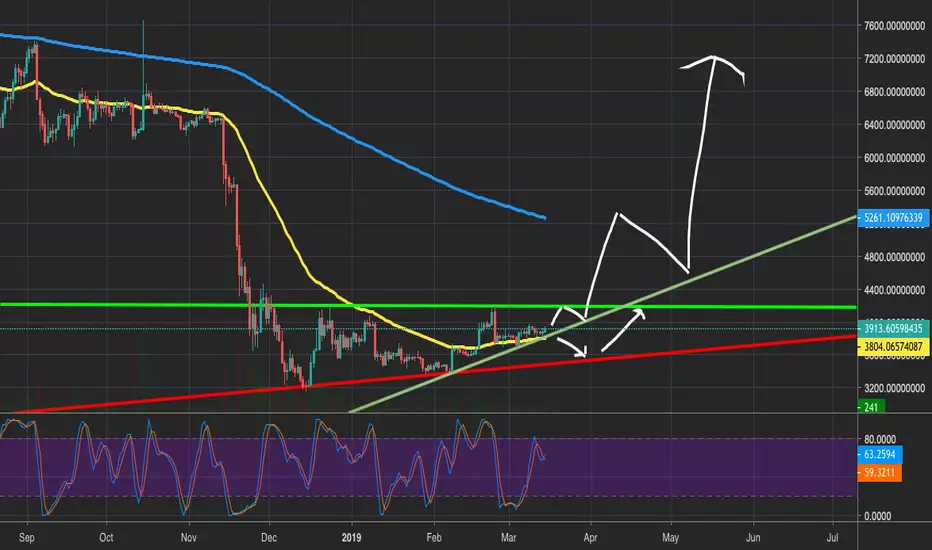
Yellow = 50 EMA
Blue = 300 EMA
After it break the vertical line at $4198. It wil most likely test the 300EMA which is the same as 50EMA on the weekly chart. On the weekly chart, the Stochastic RSI is getting to overbought levels, which is worrying, so we might see a correction soon. We have to wait and see what will happen.
Blue = 300 EMA
After it break the vertical line at $4198. It wil most likely test the 300EMA which is the same as 50EMA on the weekly chart. On the weekly chart, the Stochastic RSI is getting to overbought levels, which is worrying, so we might see a correction soon. We have to wait and see what will happen.

คำจำกัดสิทธิ์ความรับผิดชอบ
ข้อมูลและบทความไม่ได้มีวัตถุประสงค์เพื่อก่อให้เกิดกิจกรรมทางการเงิน, การลงทุน, การซื้อขาย, ข้อเสนอแนะ หรือคำแนะนำประเภทอื่น ๆ ที่ให้หรือรับรองโดย TradingView อ่านเพิ่มเติมใน ข้อกำหนดการใช้งาน
คำจำกัดสิทธิ์ความรับผิดชอบ
ข้อมูลและบทความไม่ได้มีวัตถุประสงค์เพื่อก่อให้เกิดกิจกรรมทางการเงิน, การลงทุน, การซื้อขาย, ข้อเสนอแนะ หรือคำแนะนำประเภทอื่น ๆ ที่ให้หรือรับรองโดย TradingView อ่านเพิ่มเติมใน ข้อกำหนดการใช้งาน