
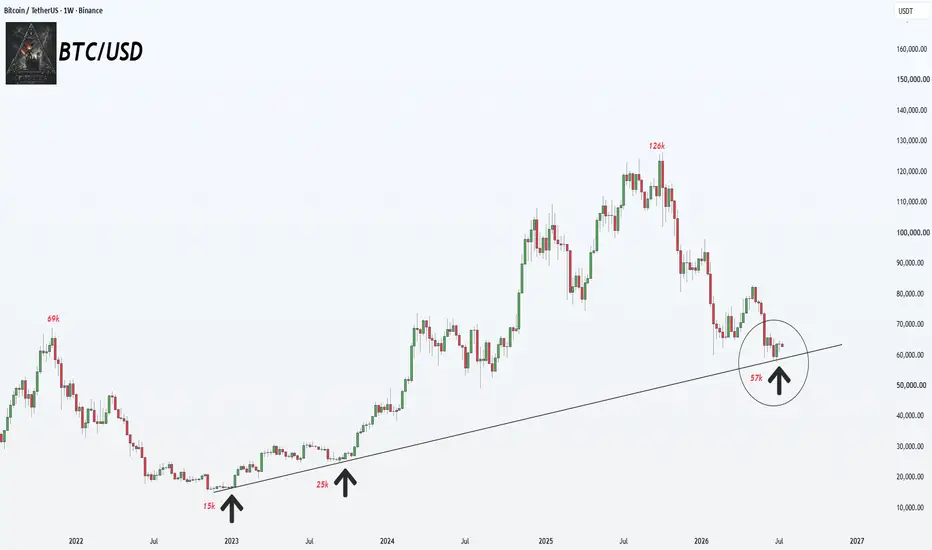
Bitcoin is once again testing the main rising structure that has carried the entire recovery from the 2022 bear market low.
This is the core chart.
The first major touch came around 15K. At the time, the market looked broken, sentiment was destroyed, and most people were still waiting for lower prices. That zone later became the origin of the next major recovery.
The second major touch came around 25K. Again, the market was uncertain. Again, the structure held. And again, Bitcoin used that area as a base before the next expansion.
Now tthe third major test is happening around 57K.
Different price.
Same cycle question.
This is why I do not read this area as just another correction. Bitcoin is not randomly falling into empty space. It is testing the same rising cycle spine that kept the structure alive before.
The important question is not whether the chart looks comfortable here. It does not. These zones never look comfortable in real time. They usually appear when the crowd is tired, bearish, impatient and convinced that one more lower low is coming.
That is exactly why this level matters.
Strong cycle structures are not built when everyone feels safe. They are built when price returns to a critical line and forces the market to decide whether the trend is still alive.
If this rising support holds, the current area can become the third major cycle base of this structure. In that case, the market is not showing the end of the cycle. It is showing the place where the next leg begins to form before most people are ready to believe it.
The second chart adds an important confirmation layer.
BTC/DXY shows Bitcoin measured against the dollar regime, not just against USD price. This matters because BTC/USD can show weakness, while BTC/DXY tells us whether Bitcoin is still holding its deeper relative structure against dollar strength.
On the BTC/DXY chart, Bitcoin is also back near the lower rail of a long term cycle structure. The previous yellow zones appeared near major stress areas such as the 2018 bottom, the Covid crash, the 2022 bottom and now the current reset zone.
The message is consistent.
BTC/USD is testing the cycle spine.
BTC/DXY is testing the dollar adjusted cycle floor.
That combination is important.
It means Bitcoin is not only testing a simple price support. It is testing whether the broader cycle structure still survives both in nominal terms and against the dollar regime.
This is where market psychology becomes dangerous. The crowd usually wants confirmation before acting. But cycle bottoms and major continuation bases rarely arrive with confirmation first. They arrive with fear first, then structure, then disbelief, then recovery.
For the bullish thesis to strengthen, Bitcoin needs to hold this rising BTC/USD support and start reclaiming strength above the recent breakdown area. A recovery back above the first resistance zone would show that this was not only a reaction, but the beginning of structural repair.
For the deeper macro confirmation, BTC/DXY also needs to defend its lower rail and begin moving back toward the midline of its structure. That would tell us Bitcoin is not only bouncing in dollar terms, but also rebuilding strength against the dollar index.

The risk is clear. If BTC/USD loses this rising support and fails to reclaim it, the cycle structure weakens. If BTC/DXY also breaks its lower rail, the market would be telling us that this is not just a reset, but a deeper structural failure.
Until that happens, this remains one of the most important Bitcoin cycle location tests of the current phase.
15K built the first base.
25K built the second base.
57K is now testing the third.
crowd sees weakness.
The structure is asking whether Bitcoin is preparing the next cycle leg from the same kind of place where previous recoveries began.
This is the core chart.
The first major touch came around 15K. At the time, the market looked broken, sentiment was destroyed, and most people were still waiting for lower prices. That zone later became the origin of the next major recovery.
The second major touch came around 25K. Again, the market was uncertain. Again, the structure held. And again, Bitcoin used that area as a base before the next expansion.
Now tthe third major test is happening around 57K.
Different price.
Same cycle question.
This is why I do not read this area as just another correction. Bitcoin is not randomly falling into empty space. It is testing the same rising cycle spine that kept the structure alive before.
The important question is not whether the chart looks comfortable here. It does not. These zones never look comfortable in real time. They usually appear when the crowd is tired, bearish, impatient and convinced that one more lower low is coming.
That is exactly why this level matters.
Strong cycle structures are not built when everyone feels safe. They are built when price returns to a critical line and forces the market to decide whether the trend is still alive.
If this rising support holds, the current area can become the third major cycle base of this structure. In that case, the market is not showing the end of the cycle. It is showing the place where the next leg begins to form before most people are ready to believe it.
The second chart adds an important confirmation layer.
BTC/DXY shows Bitcoin measured against the dollar regime, not just against USD price. This matters because BTC/USD can show weakness, while BTC/DXY tells us whether Bitcoin is still holding its deeper relative structure against dollar strength.
On the BTC/DXY chart, Bitcoin is also back near the lower rail of a long term cycle structure. The previous yellow zones appeared near major stress areas such as the 2018 bottom, the Covid crash, the 2022 bottom and now the current reset zone.
The message is consistent.
BTC/USD is testing the cycle spine.
BTC/DXY is testing the dollar adjusted cycle floor.
That combination is important.
It means Bitcoin is not only testing a simple price support. It is testing whether the broader cycle structure still survives both in nominal terms and against the dollar regime.
This is where market psychology becomes dangerous. The crowd usually wants confirmation before acting. But cycle bottoms and major continuation bases rarely arrive with confirmation first. They arrive with fear first, then structure, then disbelief, then recovery.
For the bullish thesis to strengthen, Bitcoin needs to hold this rising BTC/USD support and start reclaiming strength above the recent breakdown area. A recovery back above the first resistance zone would show that this was not only a reaction, but the beginning of structural repair.
For the deeper macro confirmation, BTC/DXY also needs to defend its lower rail and begin moving back toward the midline of its structure. That would tell us Bitcoin is not only bouncing in dollar terms, but also rebuilding strength against the dollar index.
The risk is clear. If BTC/USD loses this rising support and fails to reclaim it, the cycle structure weakens. If BTC/DXY also breaks its lower rail, the market would be telling us that this is not just a reset, but a deeper structural failure.
Until that happens, this remains one of the most important Bitcoin cycle location tests of the current phase.
15K built the first base.
25K built the second base.
57K is now testing the third.
crowd sees weakness.
The structure is asking whether Bitcoin is preparing the next cycle leg from the same kind of place where previous recoveries began.

▸ Crypto Cycles: cycle phase mapping, structural analysis
▸ Fractals: historical pattern, cycle anatomy
▸ Onchain
▸ Macro
▸ Market Psychology
▸Altcoin Charts
Subscribe on X → @Cryptollica
x.com/Cryptollica/creator-subscriptions/subscribe
▸ Fractals: historical pattern, cycle anatomy
▸ Onchain
▸ Macro
▸ Market Psychology
▸Altcoin Charts
Subscribe on X → @Cryptollica
x.com/Cryptollica/creator-subscriptions/subscribe
คำจำกัดสิทธิ์ความรับผิดชอบ
ข้อมูลและบทความไม่ได้มีวัตถุประสงค์เพื่อก่อให้เกิดกิจกรรมทางการเงิน, การลงทุน, การซื้อขาย, ข้อเสนอแนะ หรือคำแนะนำประเภทอื่น ๆ ที่ให้หรือรับรองโดย TradingView อ่านเพิ่มเติมใน ข้อกำหนดการใช้งาน
▸ Crypto Cycles: cycle phase mapping, structural analysis
▸ Fractals: historical pattern, cycle anatomy
▸ Onchain
▸ Macro
▸ Market Psychology
▸Altcoin Charts
Subscribe on X → @Cryptollica
x.com/Cryptollica/creator-subscriptions/subscribe
▸ Fractals: historical pattern, cycle anatomy
▸ Onchain
▸ Macro
▸ Market Psychology
▸Altcoin Charts
Subscribe on X → @Cryptollica
x.com/Cryptollica/creator-subscriptions/subscribe
คำจำกัดสิทธิ์ความรับผิดชอบ
ข้อมูลและบทความไม่ได้มีวัตถุประสงค์เพื่อก่อให้เกิดกิจกรรมทางการเงิน, การลงทุน, การซื้อขาย, ข้อเสนอแนะ หรือคำแนะนำประเภทอื่น ๆ ที่ให้หรือรับรองโดย TradingView อ่านเพิ่มเติมใน ข้อกำหนดการใช้งาน