
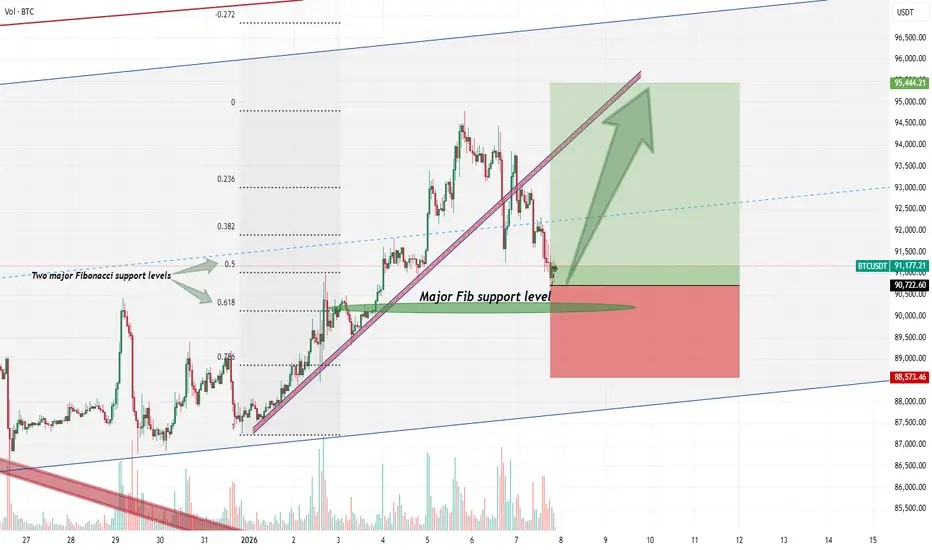
1. Fibonacci Analysis:
the significance of the 0.5 (50%) and 0.618 (61.8%) Fibonacci retracement levels derived from the prior major swing. These are two of the most critical confluence zones in technical analysis, where institutional and algorithmic buy-side liquidity is often clustered.
2. Price Action Interpretation:
The fact that the price has respected these levels and initiated a bounce indicates strong underlying demand. The current test of this Fibonacci support cluster is a classic bullish consolidation pattern within a larger uptrend. A firm rejection from this zone would confirm the strength of the trend and signal that the correction is likely complete.
3. Market Expectation:
We anticipate that this Fibonacci support confluence will hold strong, serving as a launchpad for the next impulsive wave. A successful hold here increases the probability of a resumption of the uptrend, targeting a break above the recent high and extension toward new cycle highs.
4. Trade Signal & Risk Management:
Direction: Long
Trigger: A bullish rejection candle (e.g., hammer, bullish engulfing) on the 4H or daily chart at the 0.5–0.618 Fib zone, accompanied by rising volume.
Stop-Loss (SL): Placed just below the 0.78 Fib level (e.g., below $88600) to invalidate the thesis on a breakdown.
Take-Profit (TP): Set at a 1:2 Risk-Reward (R:R) ratio. The first TP target would be the prior swing high, with the final TP projected for a measured move toward new highs.
Risk: Position size must be calculated so that the potential loss from the SL is within your strict maximum risk-per-trade parameters (e.g., 1-2% of portfolio).
Summary:
The confluence of two major Fibonacci retracements provides a high-probability, low-risk area for a long entry. The setup offers a favorable asymmetric risk-reward profile (1:2 R:R). Execution depends on a confirmed bullish reaction at the defined support zone.
😊DISCLAIMER: ((trade based on your own decision))👽
the significance of the 0.5 (50%) and 0.618 (61.8%) Fibonacci retracement levels derived from the prior major swing. These are two of the most critical confluence zones in technical analysis, where institutional and algorithmic buy-side liquidity is often clustered.
2. Price Action Interpretation:
The fact that the price has respected these levels and initiated a bounce indicates strong underlying demand. The current test of this Fibonacci support cluster is a classic bullish consolidation pattern within a larger uptrend. A firm rejection from this zone would confirm the strength of the trend and signal that the correction is likely complete.
3. Market Expectation:
We anticipate that this Fibonacci support confluence will hold strong, serving as a launchpad for the next impulsive wave. A successful hold here increases the probability of a resumption of the uptrend, targeting a break above the recent high and extension toward new cycle highs.
4. Trade Signal & Risk Management:
Direction: Long
Trigger: A bullish rejection candle (e.g., hammer, bullish engulfing) on the 4H or daily chart at the 0.5–0.618 Fib zone, accompanied by rising volume.
Stop-Loss (SL): Placed just below the 0.78 Fib level (e.g., below $88600) to invalidate the thesis on a breakdown.
Take-Profit (TP): Set at a 1:2 Risk-Reward (R:R) ratio. The first TP target would be the prior swing high, with the final TP projected for a measured move toward new highs.
Risk: Position size must be calculated so that the potential loss from the SL is within your strict maximum risk-per-trade parameters (e.g., 1-2% of portfolio).
Summary:
The confluence of two major Fibonacci retracements provides a high-probability, low-risk area for a long entry. The setup offers a favorable asymmetric risk-reward profile (1:2 R:R). Execution depends on a confirmed bullish reaction at the defined support zone.
😊DISCLAIMER: ((trade based on your own decision))👽
การซื้อขายยังคงดำเนินอยู่
Full target reached price react well to the support zone.
Bybit #2 exchange. New users: get up to $35K rewards + $100 free bonus via my link. 👇
bit.ly/3Ry64DB
My telegram channel: t.me/mmbtchannel
VIP Channels:
Crypto +390% & Forex:+600Pips monthly.
check My telegram for more info VIPs.
bit.ly/3Ry64DB
My telegram channel: t.me/mmbtchannel
VIP Channels:
Crypto +390% & Forex:+600Pips monthly.
check My telegram for more info VIPs.
การนำเสนอที่เกี่ยวข้อง
คำจำกัดสิทธิ์ความรับผิดชอบ
ข้อมูลและบทความไม่ได้มีวัตถุประสงค์เพื่อก่อให้เกิดกิจกรรมทางการเงิน, การลงทุน, การซื้อขาย, ข้อเสนอแนะ หรือคำแนะนำประเภทอื่น ๆ ที่ให้หรือรับรองโดย TradingView อ่านเพิ่มเติมใน ข้อกำหนดการใช้งาน
Bybit #2 exchange. New users: get up to $35K rewards + $100 free bonus via my link. 👇
bit.ly/3Ry64DB
My telegram channel: t.me/mmbtchannel
VIP Channels:
Crypto +390% & Forex:+600Pips monthly.
check My telegram for more info VIPs.
bit.ly/3Ry64DB
My telegram channel: t.me/mmbtchannel
VIP Channels:
Crypto +390% & Forex:+600Pips monthly.
check My telegram for more info VIPs.
การนำเสนอที่เกี่ยวข้อง
คำจำกัดสิทธิ์ความรับผิดชอบ
ข้อมูลและบทความไม่ได้มีวัตถุประสงค์เพื่อก่อให้เกิดกิจกรรมทางการเงิน, การลงทุน, การซื้อขาย, ข้อเสนอแนะ หรือคำแนะนำประเภทอื่น ๆ ที่ให้หรือรับรองโดย TradingView อ่านเพิ่มเติมใน ข้อกำหนดการใช้งาน