
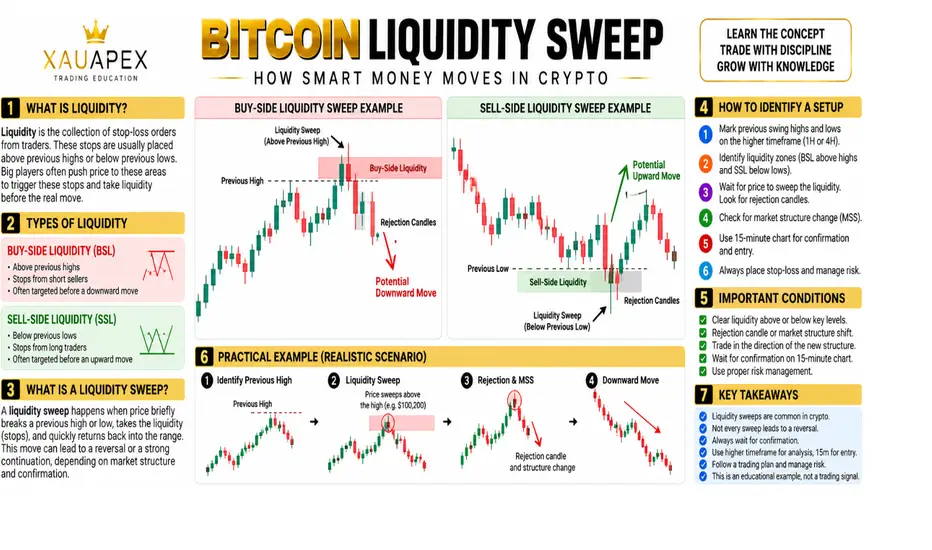
Bitcoin Liquidity Sweep Explained: How Smart Money Concepts Work in Crypto
Introduction
Understanding liquidity is an important part of cryptocurrency trading, especially when analyzing Bitcoin (BTCUSD). Price movements around previous highs and lows can provide useful information about market behavior, potential reversals, and continuation patterns.
In this educational guide, we will explore liquidity sweeps, Buy-Side Liquidity (BSL), Sell-Side Liquidity (SSL), rejection candles, Market Structure Shift (MSS), and how traders can combine these concepts with price action to build a structured trading plan.
The goal is not to predict every Bitcoin move, but to understand market structure and wait for confirmation.
1. What Is Liquidity in Crypto Trading?
Liquidity refers to how easily an asset can be bought or sold without significantly affecting its price. In Smart Money Concepts (SMC), traders also use the term liquidity to describe areas where stop-loss orders and other potential trading orders may be concentrated.
In cryptocurrency markets, these areas are often associated with:
Previous swing highs and swing lows
Equal highs and equal lows
Major support and resistance levels
Consolidation ranges
Obvious breakout levels
These areas can attract price because orders may be clustered around them. However, traders cannot know the exact location or volume of all stop-loss orders from a standard candlestick chart.
2. What Is Buy-Side Liquidity (BSL)?
Buy-Side Liquidity is commonly associated with potential buy-stop orders located above previous highs.
For example, when Bitcoin forms a clear resistance level, some short sellers may place their stop-loss orders above that high. Breakout traders may also place buy-stop orders in the same area.
When price approaches this level, a sudden move above the previous high may trigger orders and increase volatility.
What to observe:
Previous swing highs
Equal highs
Price breaking above resistance
Whether price holds above the level or returns below it
Bearish rejection or a possible change in market structure
A move above a previous high does not automatically indicate a bearish reversal. Price may continue higher if the breakout is sustained.
3. What Is Sell-Side Liquidity (SSL)?
Sell-Side Liquidity is commonly associated with potential sell-stop orders below previous lows.
For example, when Bitcoin forms a clear support level, some long traders may place stop-loss orders below that low. Breakdown traders may also place sell-stop orders beneath the same level.
If price moves below the previous low and then quickly recovers, traders may interpret this behavior as a potential sell-side liquidity sweep.
What to observe:
Previous swing lows
Equal lows
A temporary break below support
A recovery back above the level
Bullish rejection or a possible bullish market structure shift
A sweep below support does not guarantee an upward reversal. Strong bearish momentum may lead to continued downside instead.
4. What Is a Liquidity Sweep?
A liquidity sweep occurs when price moves beyond a notable high or low and then reverses back across that level. Traders using SMC look for this behavior because it may reveal a failed breakout or a possible change in short-term market direction.
Bearish Liquidity Sweep
Bitcoin approaches a previous swing high.
Price moves above the high.
The breakout fails, and price returns below the level.
A bearish rejection candle or bearish structure shift appears.
Traders evaluate whether a short setup meets their risk-management rules.
Bullish Liquidity Sweep
Bitcoin approaches a previous swing low.
Price briefly breaks below the low.
Price recovers above the previous low.
A bullish rejection candle or bullish structure shift appears.
Traders evaluate whether a long setup meets their risk-management rules.
The most important distinction is that a liquidity sweep is a price-action observation, not a guaranteed reversal signal.
5. How to Identify a Bitcoin Liquidity Sweep
A structured analysis process can help reduce impulsive decisions.
Step 1: Identify the Higher-Timeframe Structure
Start with the 4-hour (4H) or 1-hour (1H) chart. Determine whether Bitcoin is trending upward, trending downward, or consolidating.
Step 2: Mark Important Highs and Lows
Identify recent swing points, equal highs, equal lows, and clearly visible support and resistance levels.
Step 3: Wait for the Sweep
Observe whether price moves beyond one of these levels. Avoid assuming that every breakout is a sweep.
Step 4: Look for Rejection
Check whether price returns inside the previous range. A long wick, rejection candle, or strong close back inside the range may provide additional evidence.
Step 5: Wait for Market Structure Confirmation
Look for a potential Market Structure Shift (MSS) or a break of a relevant short-term swing point in the expected direction.
Step 6: Refine the Setup
Use the 15-minute (15M) chart to study the entry structure, provided it agrees with the broader market context.
Step 7: Define Risk Before Entry
Determine the invalidation level, stop-loss placement, position size, and potential reward-to-risk ratio before considering a trade.
6. The Role of Rejection Candles
Rejection candles can help traders understand how price reacts around important liquidity levels.
Bearish Rejection
A bearish rejection may occur when price moves above a previous high but closes back below it. A prominent upper wick can suggest that buyers failed to maintain the higher price.
Bullish Rejection
A bullish rejection may occur when price moves below a previous low but closes back above it. A prominent lower wick can suggest that sellers failed to maintain the lower price.
Candlestick patterns should be interpreted in context. A wick by itself is not sufficient confirmation, particularly during periods of high volatility.
7. What Is Market Structure Shift (MSS)?
A Market Structure Shift is a potential change in short-term price direction.
After a possible bearish liquidity sweep, a break below a relevant short-term swing low may support a bearish interpretation.
After a possible bullish liquidity sweep, a break above a relevant short-term swing high may support a bullish interpretation.
For example:
Price sweeps a previous high.
Price returns below that high.
A relevant short-term swing low breaks.
The bearish scenario gains additional confirmation.
The reverse logic applies to a potential bullish setup. Traders should distinguish a genuine structural break from a brief wick or insignificant price fluctuation.
8. Practical Bitcoin Example
Consider a hypothetical BTCUSD scenario in which Bitcoin has a previous swing high at $100,000.
Price rises to $100,200, then falls and closes below $100,000. A bearish rejection appears, followed by a break below a relevant short-term swing low.
A trader using a liquidity-sweep strategy may interpret these events as a potential bearish setup.
Before considering an entry, the trader would evaluate:
Whether the higher-timeframe structure supports the scenario
Whether the sweep and rejection are clearly visible
Whether market structure confirms the direction
Where the bearish scenario becomes invalid
Whether the potential reward justifies the risk
The $100,000 and $100,200 prices are illustrative only. They are not current market levels or a live trading signal.
9. Common Liquidity Sweep Trading Mistakes
Mistake 1: Selling Every Break Above a High
A breakout may be genuine. Wait for price to return below the level and look for additional confirmation.
Mistake 2: Buying Every Break Below a Low
A breakdown may continue. A recovery and structural confirmation can help distinguish a possible sweep from sustained selling pressure.
Mistake 3: Ignoring the Higher Timeframe
A short-term sweep against a strong trend may have a different meaning from a sweep occurring at a major higher-timeframe level.
Mistake 4: Entering Too Early
Entering immediately after a wick crosses a level may expose a trader to continued momentum in the breakout direction.
Mistake 5: Using Excessive Leverage
Crypto markets can experience rapid price movements, slippage, and liquidation risk. High leverage can magnify losses.
Mistake 6: Ignoring Risk Management
No setup is guaranteed to work. A predefined invalidation level and suitable position sizing are essential parts of a disciplined trading process.
10. Risk Management for BTCUSD
Before considering any trade, establish the maximum acceptable loss and calculate position size accordingly.
Define the invalidation level before entry.
Place a stop-loss according to the trade's structure and risk plan.
Consider volatility, spreads, fees, and slippage.
Avoid risking money needed for essential expenses.
Do not increase position size impulsively after a loss.
Test the approach on historical charts and a demo account before using real capital.
A favorable reward-to-risk ratio does not guarantee profitability. Results depend on execution, market conditions, and the strategy's performance over a meaningful sample of trades.
11. Final Takeaway
Liquidity sweeps are a useful concept within Smart Money Concepts and price-action analysis. By studying previous highs and lows, observing failed breakouts, and waiting for rejection and market structure confirmation, traders can develop a more systematic way to evaluate potential Bitcoin setups.
However, not every sweep results in a reversal, and no single candle pattern can predict the market with certainty.
Study the level. Observe the reaction. Wait for confirmation. Manage the risk.
At XAUAPEX, the focus is on market structure, liquidity, price action, trading education, and disciplined risk management—not guaranteed profits.
Disclaimer
This content is for educational and informational purposes only and is not financial or investment advice. Cryptocurrency trading involves substantial risk, including the possible loss of all invested capital. The examples are hypothetical and do not represent live trading signals or guaranteed outcomes. Always conduct independent research and use appropriate risk management.

📲 Join Our Telegram Community
t.me/+rSX57G_rhcFlMTA0
t.me/+rSX57G_rhcFlMTA0
การนำเสนอที่เกี่ยวข้อง
คำจำกัดสิทธิ์ความรับผิดชอบ
ข้อมูลและบทความไม่ได้มีวัตถุประสงค์เพื่อก่อให้เกิดกิจกรรมทางการเงิน, การลงทุน, การซื้อขาย, ข้อเสนอแนะ หรือคำแนะนำประเภทอื่น ๆ ที่ให้หรือรับรองโดย TradingView อ่านเพิ่มเติมใน ข้อกำหนดการใช้งาน