
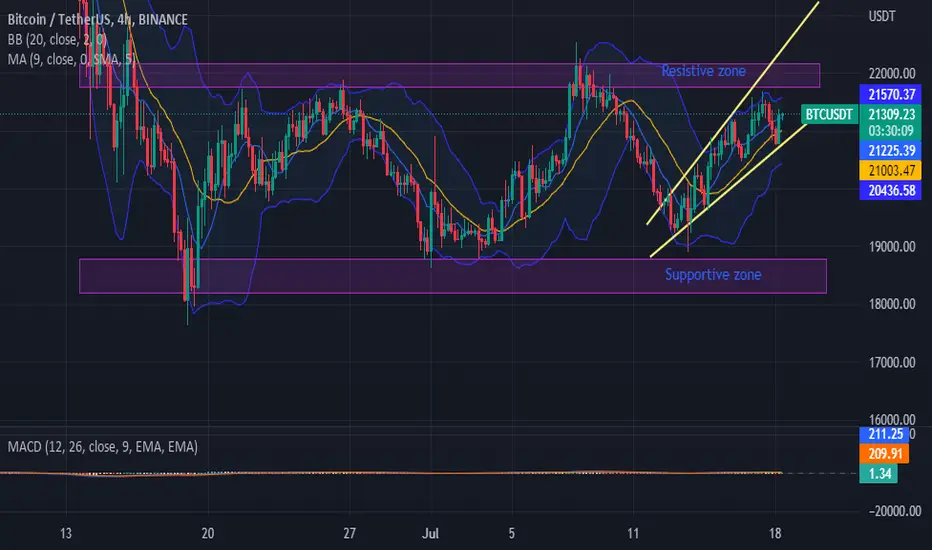
Observed rising wedge (yellow colour lines) pattern on BTCUSDT/4 hour chart
Upper side of the wedge is the resistive zone (21785-22170)/rough values
Below side of the wedge is the supportive zone (18150-18770)/rough values
Price either will hit resistive zone and go to down side(To continue rising wedge pattern)
OR
Price will break the resistive zone and go upside. (To break the market structure).
Upper side of the wedge is the resistive zone (21785-22170)/rough values
Below side of the wedge is the supportive zone (18150-18770)/rough values
Price either will hit resistive zone and go to down side(To continue rising wedge pattern)
OR
Price will break the resistive zone and go upside. (To break the market structure).

คำจำกัดสิทธิ์ความรับผิดชอบ
ข้อมูลและบทความไม่ได้มีวัตถุประสงค์เพื่อก่อให้เกิดกิจกรรมทางการเงิน, การลงทุน, การซื้อขาย, ข้อเสนอแนะ หรือคำแนะนำประเภทอื่น ๆ ที่ให้หรือรับรองโดย TradingView อ่านเพิ่มเติมใน ข้อกำหนดการใช้งาน
คำจำกัดสิทธิ์ความรับผิดชอบ
ข้อมูลและบทความไม่ได้มีวัตถุประสงค์เพื่อก่อให้เกิดกิจกรรมทางการเงิน, การลงทุน, การซื้อขาย, ข้อเสนอแนะ หรือคำแนะนำประเภทอื่น ๆ ที่ให้หรือรับรองโดย TradingView อ่านเพิ่มเติมใน ข้อกำหนดการใช้งาน