
Hello?
Nice to meet you, fellow traders.
If you "follow" me, you can always get the latest information quickly.
Have a great day.
-------------------------------------
#ETHUSDT
This volatility period ends on June 17.
If it fails to rise above the Fibonacci 0.236 (1781.84),
1st: 1666.58
2nd: 1569.69 ~ 1597.76
We need to check for support around the 1st and 2nd levels mentioned above.
Since the 1569.69 ~ 1666.58 range corresponds to a low point zone, support in this area is crucial.
----------------------------------------------
#BTCUSDT
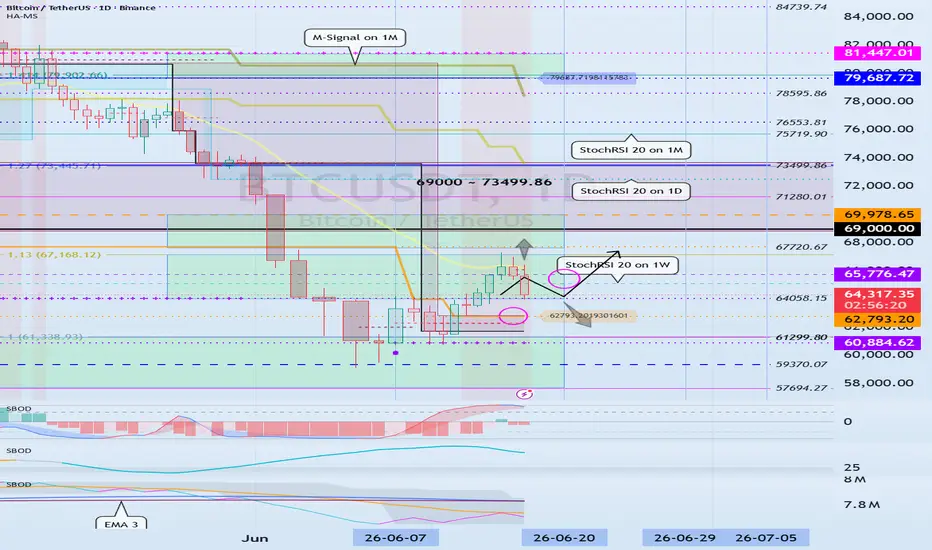
As ETH's volatility period ends, the key question is how it will move as it passes through BTC's volatility period around June 20 (June 19 ~ 21).
If it finds support around 64058.15 and rises, it appears likely to gain momentum for the upward movement.
However, since the StochRSI indicator is currently in the overbought zone, there is a possibility that further upside may be constrained.
Therefore, it is necessary to observe the position when the StochRSI indicator moves out of the overbought zone and turns upward again.
For the price to rise while the StochRSI is in the overbought zone, the OBV indicator must also rise.
In other words, it must show an upward movement driven by buying pressure.
Otherwise, the StochRSI indicator will eventually show a downward trend within the overbought zone.
Therefore, it is advisable to monitor the OBV and StochRSI indicators together.
-
Thank you for reading to the end.
I wish you successful trading.
--------------------------------------------------
การซื้อขายยังคงดำเนินอยู่
#BTCUSDTThis period of volatility is expected to continue until June 21st.
Accordingly, we need to confirm whether support is found around 64058.15.
If it finds support in the 62793.20–64058.15 range and rises, we need to monitor whether the StochRSI indicator turns bullish.
Additionally, we must also confirm whether the OBV indicator shows an uptrend by rising above the EMA 1.
If it fails to rise, it is expected to fall back to the 57694.27–61299.80 range.
Significant movements are expected to occur around June 29th, the next period of volatility.

YouTube: youtube.com/@readcrypto9837
※ Follow X to check out the posts.
※ X를 팔로우하고 게시물을 확인하세요.
◆ t.me/readCryptoChannel
[HA-MS Indicator]
bit.ly/3YxHgvN
[OBV Indicator]
bit.ly/4dcyny3
※ Follow X to check out the posts.
※ X를 팔로우하고 게시물을 확인하세요.
◆ t.me/readCryptoChannel
[HA-MS Indicator]
bit.ly/3YxHgvN
[OBV Indicator]
bit.ly/4dcyny3
การนำเสนอที่เกี่ยวข้อง
คำจำกัดสิทธิ์ความรับผิดชอบ
ข้อมูลและบทความไม่ได้มีวัตถุประสงค์เพื่อก่อให้เกิดกิจกรรมทางการเงิน, การลงทุน, การซื้อขาย, ข้อเสนอแนะ หรือคำแนะนำประเภทอื่น ๆ ที่ให้หรือรับรองโดย TradingView อ่านเพิ่มเติมใน ข้อกำหนดการใช้งาน
YouTube: youtube.com/@readcrypto9837
※ Follow X to check out the posts.
※ X를 팔로우하고 게시물을 확인하세요.
◆ t.me/readCryptoChannel
[HA-MS Indicator]
bit.ly/3YxHgvN
[OBV Indicator]
bit.ly/4dcyny3
※ Follow X to check out the posts.
※ X를 팔로우하고 게시물을 확인하세요.
◆ t.me/readCryptoChannel
[HA-MS Indicator]
bit.ly/3YxHgvN
[OBV Indicator]
bit.ly/4dcyny3
การนำเสนอที่เกี่ยวข้อง
คำจำกัดสิทธิ์ความรับผิดชอบ
ข้อมูลและบทความไม่ได้มีวัตถุประสงค์เพื่อก่อให้เกิดกิจกรรมทางการเงิน, การลงทุน, การซื้อขาย, ข้อเสนอแนะ หรือคำแนะนำประเภทอื่น ๆ ที่ให้หรือรับรองโดย TradingView อ่านเพิ่มเติมใน ข้อกำหนดการใช้งาน