
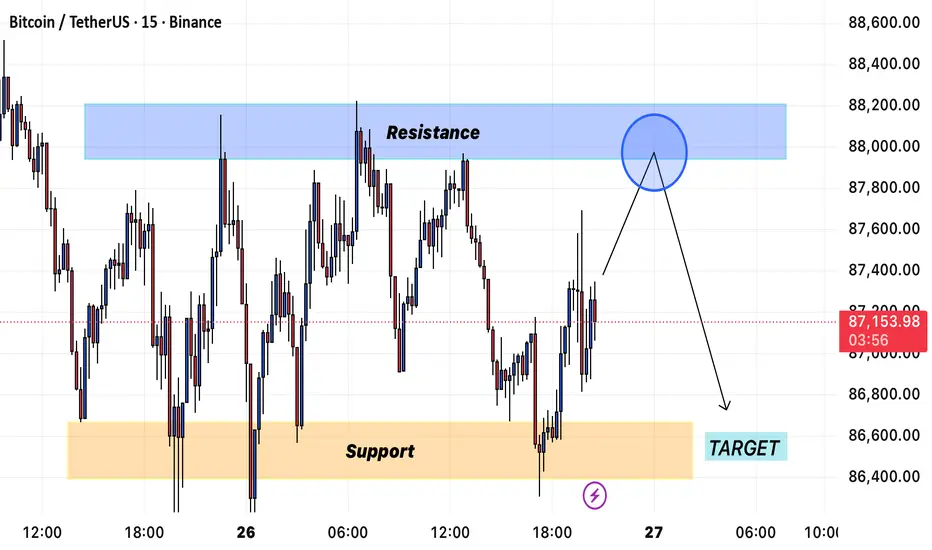
Bitcoin is currently ranging between a well-defined resistance zone near 88,000–88,400 and a support zone around 86,700–86,300. Price action shows repeated rejections at the top of the range, suggesting strong selling interest.
🔵 Resistance Zone (88,000–88,400)
This blue block has acted as a major supply area. Each time price taps into this zone, sellers quickly push the market back down.
The circle on the chart highlights a potential final liquidity grab before a move lower.
• Expectation: Price may spike back into the resistance block to collect liquidity before reversing.
🟡 Support Zone (86,700–86,300)
This area has held multiple times and remains the primary demand zone of the range.
However, the reactions here are becoming weaker, suggesting buyers are losing strength with each test.
📉 Bearish Scenario (Most Probable)
• Price likely moves back into the 88,000–88,400 resistance to fill liquidity.
• From there, a rejection is expected as sellers dominate.
• A break below the support zone opens the path toward your target area around 86,400.
This aligns perfectly with the downward arrow drawn on your chart.
📌 What Confirms Bearish Continuation?
• Bearish rejection candles inside the resistance zone
• Break of structure below 86,700
• Increased sell volume on the push down
❌ Bullish Invalidations
The bearish outlook is invalidated only if price:
• Breaks and closes above 88,400,
• Sustains new higher highs on the 15m.
Until then, the setup remains bearish within a range-bound market.
🔵 Resistance Zone (88,000–88,400)
This blue block has acted as a major supply area. Each time price taps into this zone, sellers quickly push the market back down.
The circle on the chart highlights a potential final liquidity grab before a move lower.
• Expectation: Price may spike back into the resistance block to collect liquidity before reversing.
🟡 Support Zone (86,700–86,300)
This area has held multiple times and remains the primary demand zone of the range.
However, the reactions here are becoming weaker, suggesting buyers are losing strength with each test.
📉 Bearish Scenario (Most Probable)
• Price likely moves back into the 88,000–88,400 resistance to fill liquidity.
• From there, a rejection is expected as sellers dominate.
• A break below the support zone opens the path toward your target area around 86,400.
This aligns perfectly with the downward arrow drawn on your chart.
📌 What Confirms Bearish Continuation?
• Bearish rejection candles inside the resistance zone
• Break of structure below 86,700
• Increased sell volume on the push down
❌ Bullish Invalidations
The bearish outlook is invalidated only if price:
• Breaks and closes above 88,400,
• Sustains new higher highs on the 15m.
Until then, the setup remains bearish within a range-bound market.

คำจำกัดสิทธิ์ความรับผิดชอบ
ข้อมูลและบทความไม่ได้มีวัตถุประสงค์เพื่อก่อให้เกิดกิจกรรมทางการเงิน, การลงทุน, การซื้อขาย, ข้อเสนอแนะ หรือคำแนะนำประเภทอื่น ๆ ที่ให้หรือรับรองโดย TradingView อ่านเพิ่มเติมใน ข้อกำหนดการใช้งาน
คำจำกัดสิทธิ์ความรับผิดชอบ
ข้อมูลและบทความไม่ได้มีวัตถุประสงค์เพื่อก่อให้เกิดกิจกรรมทางการเงิน, การลงทุน, การซื้อขาย, ข้อเสนอแนะ หรือคำแนะนำประเภทอื่น ๆ ที่ให้หรือรับรองโดย TradingView อ่านเพิ่มเติมใน ข้อกำหนดการใช้งาน