
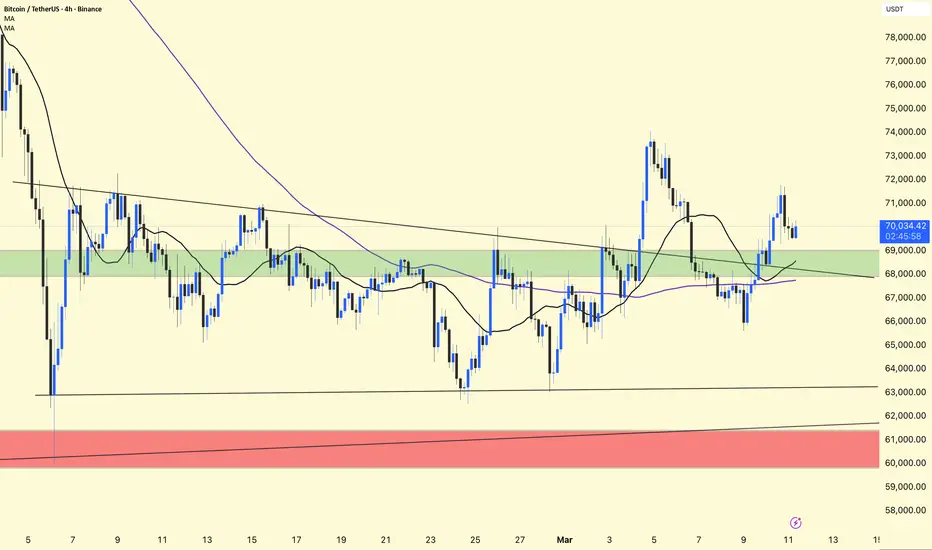
BTC/USDT – 4H Chart Update
Bitcoin is currently trading near $70K, holding above a key **support zone around $68K–$69K
* Price reclaimed the **green demand zone** and is now consolidating above it.
* The **short-term moving averages** are starting to curl upward, showing improving momentum.
* However, the **descending trendline resistance** from previous highs is still above the price.
📈 Bullish Scenario:
If BTC holds above $68K, buyers may push the price toward:
$71K – $72K resistance
Potential breakout target near $74K
📉 Bearish Scenario:
Losing $68K support could send BTC back to:
$63K support
Major demand zone around $60K–$61K
BTC is in a short-term recovery phase, but it still needs to break the descending resistance to confirm stronger upside momentum.
Bitcoin is currently trading near $70K, holding above a key **support zone around $68K–$69K
* Price reclaimed the **green demand zone** and is now consolidating above it.
* The **short-term moving averages** are starting to curl upward, showing improving momentum.
* However, the **descending trendline resistance** from previous highs is still above the price.
📈 Bullish Scenario:
If BTC holds above $68K, buyers may push the price toward:
$71K – $72K resistance
Potential breakout target near $74K
📉 Bearish Scenario:
Losing $68K support could send BTC back to:
$63K support
Major demand zone around $60K–$61K
BTC is in a short-term recovery phase, but it still needs to break the descending resistance to confirm stronger upside momentum.

การนำเสนอที่เกี่ยวข้อง
คำจำกัดสิทธิ์ความรับผิดชอบ
ข้อมูลและบทความไม่ได้มีวัตถุประสงค์เพื่อก่อให้เกิดกิจกรรมทางการเงิน, การลงทุน, การซื้อขาย, ข้อเสนอแนะ หรือคำแนะนำประเภทอื่น ๆ ที่ให้หรือรับรองโดย TradingView อ่านเพิ่มเติมใน ข้อกำหนดการใช้งาน
การนำเสนอที่เกี่ยวข้อง
คำจำกัดสิทธิ์ความรับผิดชอบ
ข้อมูลและบทความไม่ได้มีวัตถุประสงค์เพื่อก่อให้เกิดกิจกรรมทางการเงิน, การลงทุน, การซื้อขาย, ข้อเสนอแนะ หรือคำแนะนำประเภทอื่น ๆ ที่ให้หรือรับรองโดย TradingView อ่านเพิ่มเติมใน ข้อกำหนดการใช้งาน