
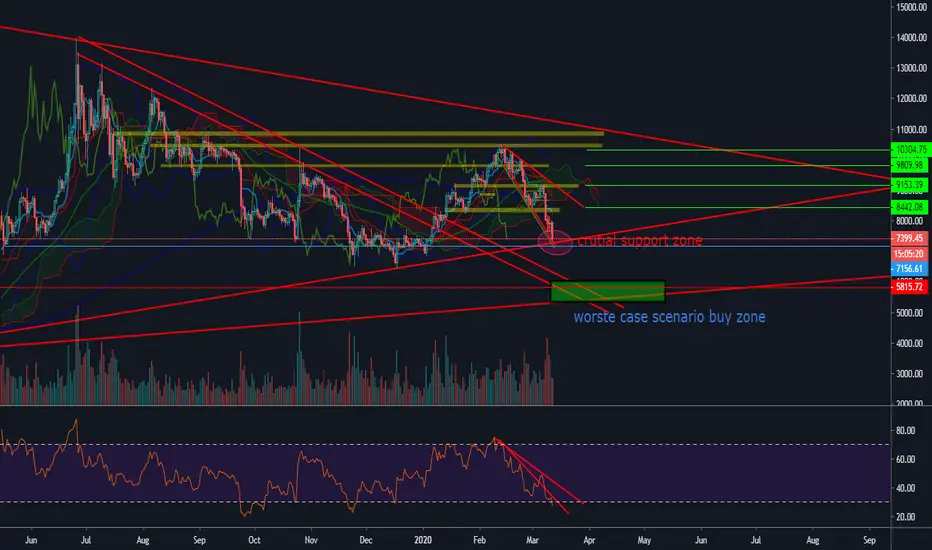
BTC on a very important support zone if finger crossed as the trendlines crossed in this support price holds above 7250 daily candle and 7100-7300 in lower time frames we see a pump toward designated targets shown in the chart with green and RSI indicator showing over sold in zone indicates a possible pullback.
but there are more bearish patterns available here ichimiku red cloud - chiko span under the cloud - rsi bearish trend has not break above - selling pressure and many others i personally think of a bearish scenario in short term but btc always surprised everyone
we`ll see...
but there are more bearish patterns available here ichimiku red cloud - chiko span under the cloud - rsi bearish trend has not break above - selling pressure and many others i personally think of a bearish scenario in short term but btc always surprised everyone
we`ll see...

คำจำกัดสิทธิ์ความรับผิดชอบ
ข้อมูลและบทความไม่ได้มีวัตถุประสงค์เพื่อก่อให้เกิดกิจกรรมทางการเงิน, การลงทุน, การซื้อขาย, ข้อเสนอแนะ หรือคำแนะนำประเภทอื่น ๆ ที่ให้หรือรับรองโดย TradingView อ่านเพิ่มเติมใน ข้อกำหนดการใช้งาน
คำจำกัดสิทธิ์ความรับผิดชอบ
ข้อมูลและบทความไม่ได้มีวัตถุประสงค์เพื่อก่อให้เกิดกิจกรรมทางการเงิน, การลงทุน, การซื้อขาย, ข้อเสนอแนะ หรือคำแนะนำประเภทอื่น ๆ ที่ให้หรือรับรองโดย TradingView อ่านเพิ่มเติมใน ข้อกำหนดการใช้งาน