
Hello, fellow traders!
Follow us to get the latest information quickly.
Have a great day!
-------------------------------------
(BTCUSDT 1M Chart)
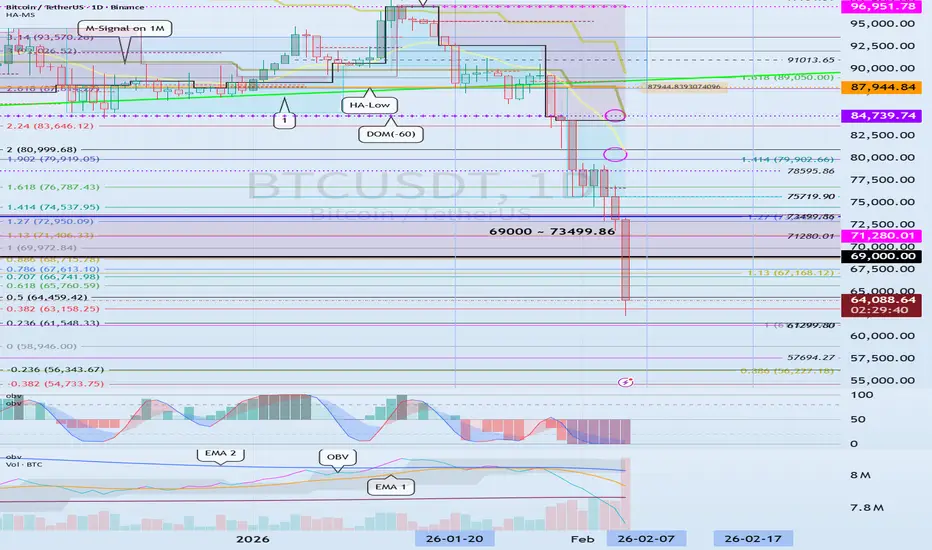
The price fell from the critical 69,000 - 73,499.86 range.
We need to see if it finds support near the previous high of 57694.27 to 61299.80.
I believe the price range it cannot return to is below the 42283.58 to 43823.59 range.
-
(1D chart)
This period of volatility is expected to last from February 6th to 8th.
Therefore, the key question is how far it can rebound.
We need to see if it can rise to the critical 69000 to 73499.86 range.
If not, we need to see if it can rise above the left Fibonacci level of 0.618 (65760.59).
The next period of volatility will be around February 17th (February 16th-18th), so the key question is where the price will begin its sideways movement after this period of volatility.
The 57694.27-61299.80 range represents the previous high point, the first significant uptrend, and thus holds some significance.
The M-Signal indicator on the 1D chart is still forming at 87944.84, so we should also monitor whether it re-forms after this period of volatility.
This is because an uptrend begins when it meets the minimum DOM (-60) or HA-Low indicator.
-
Thank you for reading to the end.
I wish you successful trading.
--------------------------------------------------
- This is an explanation of the big picture.
(3-year bull market, 1-year bear market pattern)
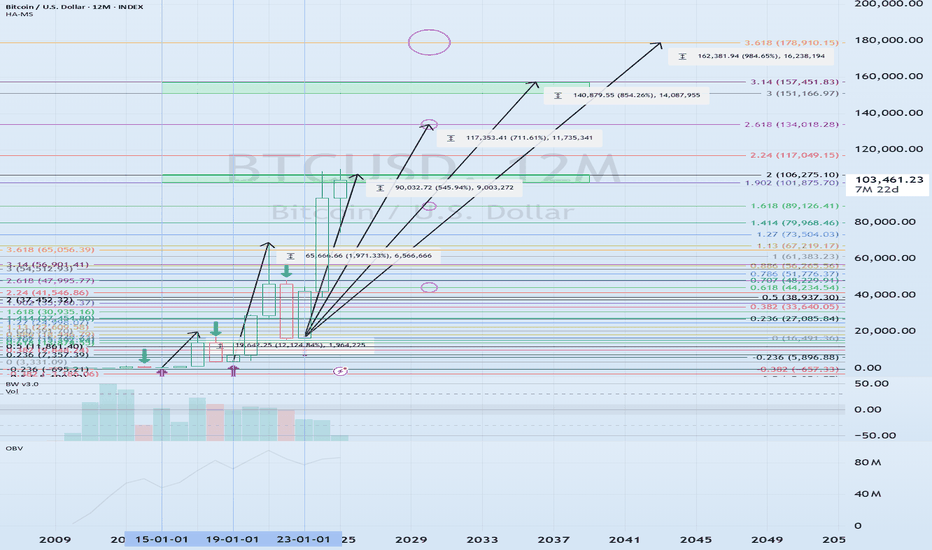
I will explain in more detail when the bear market begins.
------------------------------------------------------
บันทึก
#BTCUSDTWith this rise, the HA-Low indicator on the 1D chart is showing signs of forming a new level.
Therefore, the key question is whether the price can rise above 76,126.52 and maintain its upward momentum.
To do so, we need to see if it can find support near 70,580.26, where the DOM (-60) indicator is forming a level, and continue to rise.
Since the BSSC indicator has not risen above 0, we need to see if the price rises above 0.
The OBV indicator is showing signs of re-entering the Low Line.
We need to see if it can continue to rise and rise above EMA 3.
The OBV indicator indicates an uptrend when it rises above the High Line.
The existing TC indicator has been replaced with the BSSC indicator.
การซื้อขายยังคงดำเนินอยู่
#BTCUSDTThe price is showing signs of stopping its decline and transitioning to an uptrend.
However,
1. the BSSC indicator has failed to rise above zero,
2. the StochRSI indicator is showing signs of rising into the overbought zone,
3. the OBV indicator is still near its low line, making it difficult to continue the uptrend.
Therefore, when the price rises to the HA-Low indicator level of 76,126.52 to determine whether support is found, we should examine whether the StochRSI, BSSC, and OBV indicators are trending upward.
Therefore, the key is to determine whether support is found in the DOM(-60) ~ HA-Low range of 70,580.26 to 76,126.52.
The next period of volatility is expected to be around February 7th (February 6th-8th).
บันทึก
Currently, the coin market appears to be supported by USDC funds in the short term.
The key is that USDT must continue its gap-up trend for the coin market to likely rise.
Therefore, the key question is whether USDT can stop its gap-down trend and transition into a gap-up trend.
A gap-down in USDT or USDC means that funds are flowing out of the coin market.

YouTube: youtube.com/@readcrypto9837
※ Follow X to check out the posts.
※ X를 팔로우하고 게시물을 확인하세요.
◆ t.me/readCryptoChannel
[HA-MS Indicator]
bit.ly/3YxHgvN
[OBV Indicator]
bit.ly/4dcyny3
※ Follow X to check out the posts.
※ X를 팔로우하고 게시물을 확인하세요.
◆ t.me/readCryptoChannel
[HA-MS Indicator]
bit.ly/3YxHgvN
[OBV Indicator]
bit.ly/4dcyny3
การนำเสนอที่เกี่ยวข้อง
คำจำกัดสิทธิ์ความรับผิดชอบ
ข้อมูลและบทความไม่ได้มีวัตถุประสงค์เพื่อก่อให้เกิดกิจกรรมทางการเงิน, การลงทุน, การซื้อขาย, ข้อเสนอแนะ หรือคำแนะนำประเภทอื่น ๆ ที่ให้หรือรับรองโดย TradingView อ่านเพิ่มเติมใน ข้อกำหนดการใช้งาน
YouTube: youtube.com/@readcrypto9837
※ Follow X to check out the posts.
※ X를 팔로우하고 게시물을 확인하세요.
◆ t.me/readCryptoChannel
[HA-MS Indicator]
bit.ly/3YxHgvN
[OBV Indicator]
bit.ly/4dcyny3
※ Follow X to check out the posts.
※ X를 팔로우하고 게시물을 확인하세요.
◆ t.me/readCryptoChannel
[HA-MS Indicator]
bit.ly/3YxHgvN
[OBV Indicator]
bit.ly/4dcyny3
การนำเสนอที่เกี่ยวข้อง
คำจำกัดสิทธิ์ความรับผิดชอบ
ข้อมูลและบทความไม่ได้มีวัตถุประสงค์เพื่อก่อให้เกิดกิจกรรมทางการเงิน, การลงทุน, การซื้อขาย, ข้อเสนอแนะ หรือคำแนะนำประเภทอื่น ๆ ที่ให้หรือรับรองโดย TradingView อ่านเพิ่มเติมใน ข้อกำหนดการใช้งาน