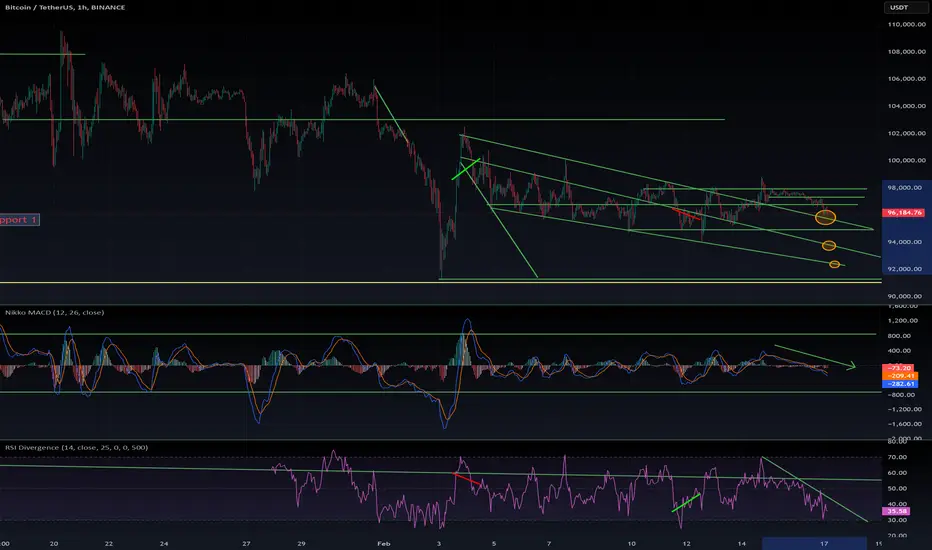
📉  BTC Chart Tells a Different Story Than Social Media
Bitcoin whales seem desperate to lure retail investors intoBTC, but the charts paint a different picture—one that looks more like a warning signal than a buying opportunity.
🚨 Key Observations
🔴 Rejected at 98K SIX times – The dream of a pump to $100K+ is fading fast.
🔴 Rejected twice at $97.2K – Further signs of weakness.
🔴 Failed support at $96.7K – Old supports are now turning into resistance.
📊 Technical Breakdown
✅ Daily Chart: Shows bullish momentum, but price action cancels it as sellers take profits.
❌ Weekly Chart: Bearish and confirmed—this trend is playing out now. (Check my weekly bearish trend warning here: 🔗 TradingView Link)
📉 Support Levels to Watch
🔻 $95.7K, $95K, $93.3K, and $92.4K
🔻BTC should not drop below $91K without a strong bounce.
🕰️ A Look Back: I Warned About This
📌 December 17, 2024: I called the market top—it seemed crazy then, not so crazy now. 🔗 TradingView Link
📌 November 25, 2024: I warned about this bearish consolidation, and it’s playing out exactly as expected. 🔗 TradingView Link
🔮 Where is the Bottom?
📍 I still believe $85K is the likely bottom of this consolidation. Charts don’t lie—math always plays out in the long run. Of course everything can happen, I am talking about probabilities.
❓ Is This the End of the Bull Market?
🤔 No clear answer. However, ETFs have changed Bitcoin’s cycle. Instead of a classic bear market, I expect:
🔹 1-month pumps 🚀
🔹 Followed by 5-month consolidations 📉 (-30% corrections)
Conclusion: We are chopping sideways, much like we did from June to October 2024. The probability of seeing $85K is high. Be cautious and trade smart. 🧐📊
The bull market will resume around May 2025.
BTC Chart Tells a Different Story Than Social MediaBitcoin whales seem desperate to lure retail investors into
BTC, but the charts paint a different picture—one that looks more like a warning signal than a buying opportunity.🚨 Key Observations
🔴 Rejected at
98K SIX times – The dream of a pump to $100K+ is fading fast.🔴 Rejected twice at $97.2K – Further signs of weakness.
🔴 Failed support at $96.7K – Old supports are now turning into resistance.
📊 Technical Breakdown
✅ Daily Chart: Shows bullish momentum, but price action cancels it as sellers take profits.
❌ Weekly Chart: Bearish and confirmed—this trend is playing out now. (Check my weekly bearish trend warning here: 🔗 TradingView Link)
📉 Support Levels to Watch
🔻 $95.7K, $95K, $93.3K, and $92.4K
🔻
BTC should not drop below $91K without a strong bounce.🕰️ A Look Back: I Warned About This
📌 December 17, 2024: I called the market top—it seemed crazy then, not so crazy now. 🔗 TradingView Link
📌 November 25, 2024: I warned about this bearish consolidation, and it’s playing out exactly as expected. 🔗 TradingView Link
🔮 Where is the Bottom?
📍 I still believe $85K is the likely bottom of this consolidation. Charts don’t lie—math always plays out in the long run. Of course everything can happen, I am talking about probabilities.
❓ Is This the End of the Bull Market?
🤔 No clear answer. However, ETFs have changed Bitcoin’s cycle. Instead of a classic bear market, I expect:
🔹 1-month pumps 🚀
🔹 Followed by 5-month consolidations 📉 (-30% corrections)
Conclusion: We are chopping sideways, much like we did from June to October 2024. The probability of seeing $85K is high. Be cautious and trade smart. 🧐📊
The bull market will resume around May 2025.
ปิดการเทรด: ถึงเป้าหมายการทำกำไร
So we reached our 3 first targets down to $93k. Mission accomplished.บันทึก
BTC <$80k today, another warning that was accurate, posted 17th Feb 2025
คำจำกัดสิทธิ์ความรับผิดชอบ
ข้อมูลและบทความไม่ได้มีวัตถุประสงค์เพื่อก่อให้เกิดกิจกรรมทางการเงิน, การลงทุน, การซื้อขาย, ข้อเสนอแนะ หรือคำแนะนำประเภทอื่น ๆ ที่ให้หรือรับรองโดย TradingView อ่านเพิ่มเติมใน ข้อกำหนดการใช้งาน
คำจำกัดสิทธิ์ความรับผิดชอบ
ข้อมูลและบทความไม่ได้มีวัตถุประสงค์เพื่อก่อให้เกิดกิจกรรมทางการเงิน, การลงทุน, การซื้อขาย, ข้อเสนอแนะ หรือคำแนะนำประเภทอื่น ๆ ที่ให้หรือรับรองโดย TradingView อ่านเพิ่มเติมใน ข้อกำหนดการใช้งาน