
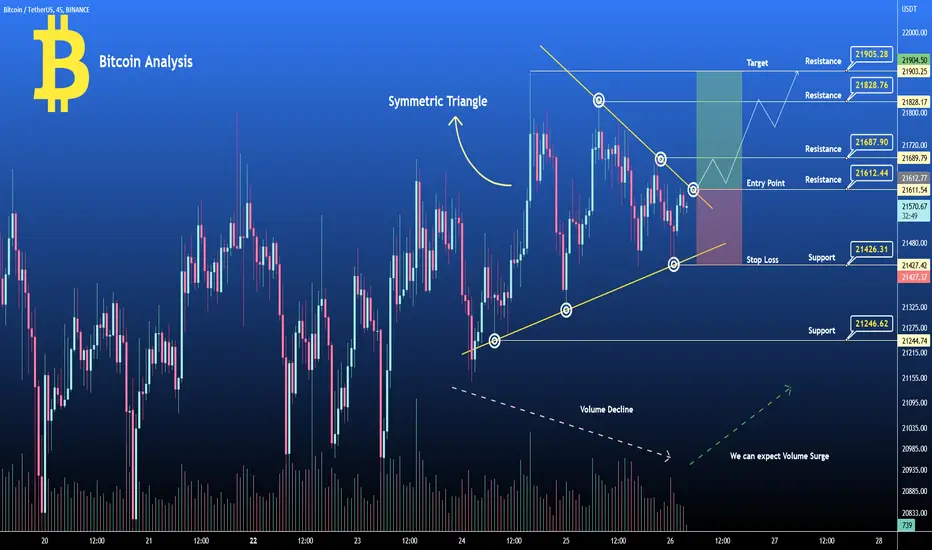
The above chart of Bitcoin ( BTCUSDT ) laid out the Symmetric triangle pattern. Currently, Bitcoin ( BTCUSDT ) is in the range of $21580. If the pattern continues, the price of Bitcoin ( BTCUSDT ) might reach the resistance levels of $21900, If the trend reverses, then the price of Bitcoin ( BTCUSDT ) may fall to $21420
RSI - Below 50
Trade Level
Buy Entry : $21615
Target : $21900
Stop Loss : $21420
Happy Trading $$$$
RSI - Below 50
Trade Level
Buy Entry : $21615
Target : $21900
Stop Loss : $21420
Happy Trading $$$$
บันทึก
บันทึก
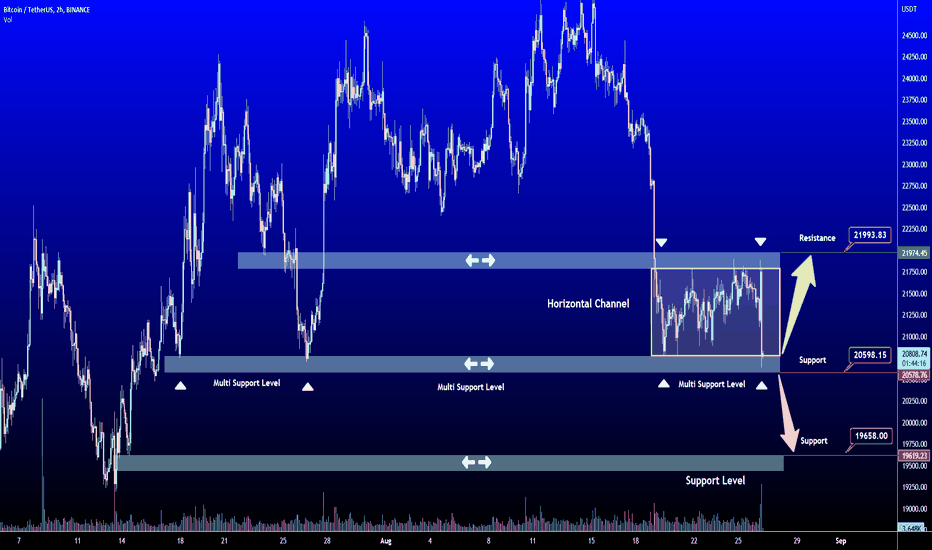
Fresh View Above
การนำเสนอที่เกี่ยวข้อง
คำจำกัดสิทธิ์ความรับผิดชอบ
ข้อมูลและบทความไม่ได้มีวัตถุประสงค์เพื่อก่อให้เกิดกิจกรรมทางการเงิน, การลงทุน, การซื้อขาย, ข้อเสนอแนะ หรือคำแนะนำประเภทอื่น ๆ ที่ให้หรือรับรองโดย TradingView อ่านเพิ่มเติมใน ข้อกำหนดการใช้งาน
การนำเสนอที่เกี่ยวข้อง
คำจำกัดสิทธิ์ความรับผิดชอบ
ข้อมูลและบทความไม่ได้มีวัตถุประสงค์เพื่อก่อให้เกิดกิจกรรมทางการเงิน, การลงทุน, การซื้อขาย, ข้อเสนอแนะ หรือคำแนะนำประเภทอื่น ๆ ที่ให้หรือรับรองโดย TradingView อ่านเพิ่มเติมใน ข้อกำหนดการใช้งาน