
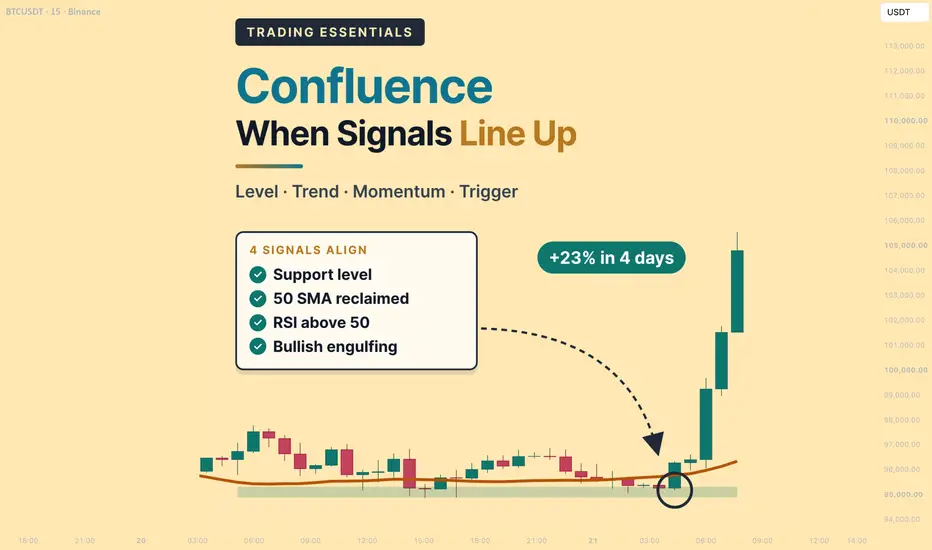
Confluence: When Signals Line Up
Difficulty: Intermediate
Most indicators give a signal on their own, and few of those signals are worth trading alone. Confluence is the habit of waiting until several different kinds of evidence point the same way — a level, a trend, momentum and a candle — before acting. This lesson goes one step further: it shows how to build that agreement on a higher timeframe, then drop to a lower timeframe to time the entry, so the stop can be tight while the target stays far away.

BTC on the daily chart, August 2026. Price had built a support area around 62,200–62,900 for three weeks. On August 17, a bullish engulfing candle formed on that support, closed back above the 50 SMA, and lifted the RSI from 41.8 to 54.3. Four independent signals on one candle. Within four days, price reached 79,511.
🔵 THE IDEA BEHIND CONFLUENCE
Every tool on a chart answers one question. A level answers where. A moving average answers which way. An oscillator answers how strong. A candle answers what buyers and sellers did right now. A lower timeframe answers exactly when.
When those answers agree, a setup tends to be cleaner:
- Fewer false signals — a signal that needs agreement from other tools is harder to trigger by noise
- Better discipline — a written list of conditions leaves less room for impulse entries
- Clearer risk — a setup built on a level gives the stop an obvious home
Confluence does not make a trade certain. It raises the quality of the setups you take, and it gives you a clear reason to skip the rest.
🔵 FIVE FAMILIES OF EVIDENCE
The key word in confluence is different. It helps to sort your tools into families and use, at most, one from each:
- Structure — support, resistance, trendlines, round numbers
- Trend — moving averages, higher highs and higher lows
- Momentum — RSI, MACD, stochastic
- Volatility — Bollinger Bands, ATR
- Participation — volume
A setup with one signal from three families usually says more than a setup with three signals from one family.
🐳 Pro Tip: Before adding a new indicator, ask which family it belongs to. If that family is already on your chart, the new tool is likely to repeat what you already see.
🔵 TOOLS THAT REPEAT EACH OTHER
Some popular combinations look like confluence but measure the same thing twice.

ETH on the daily chart with Bollinger Bands and a 20 SMA. The thick blue line is the 20 SMA; the orange line on top of it is the Bollinger basis. They are the same calculation, so a bounce from one is the same event as a bounce from the other.
- Moving averages and Bollinger Bands — the Bollinger basis is a moving average, so a touch of the basis and a touch of the 20 SMA are one signal
- MACD and RSI — both measure momentum from closing prices, so they tend to turn together; when both flip bullish, that is usually one piece of evidence seen twice
A quick test: if two tools are built from the same input and answer the same question, count them as one.
🔵 SETUP 1: TREND + MOMENTUM
This combination pairs a trend filter with a momentum trigger.

XRP on the daily chart, September 2026. Price stayed above the rising 50 SMA, and the pullback low on September 16 (1.2461) held just above it. The RSI dipped to 45.1 during the pullback, then crossed back above 50 on September 18, when price closed at 1.3961. Five days later, price reached 1.6578.
- Trend — price above a rising 50-period moving average
- Momentum — RSI crossing back above 50 after a pullback
- Location — the pullback holds near the moving average instead of breaking it
Aggressive traders may enter on the close of the RSI cross. Conservative traders often wait for the next candle to hold above the high of the pullback.
A variation of the same idea uses the MACD: a bullish crossover above the zero line, confirmed by rising volume. The logic is the same — trend, then momentum, then participation.
🔵 SETUP 2: VOLATILITY + PRICE ACTION
Volatility tools do not tell you direction. They tell you when a large move is becoming more likely. A candle pattern can supply the direction.

SOL on the 4-hour chart, August 2026. The Bollinger Bands narrowed into a tight squeeze. A bullish engulfing candle formed at the lower band, and the bands began to expand upward soon after. Price moved from 75.44 to 87.28 within three days.
- The squeeze — narrow bands show that volatility is unusually low, which often comes before expansion
- The candle — an engulfing or hammer at the edge of the range hints at which side is winning
- The expansion — bands opening in the direction of the candle confirm that the move has started
🐳 Pro Tip: A squeeze can break either way. Let the candle and the first expansion choose the direction for you instead of guessing in advance.
🔵 BUILDING CONFLUENCE IN THREE STEPS
Order matters. Starting with the level keeps the rest of the analysis anchored to a real price.

BTC on the daily chart, January 2026. A support area near 84,400–86,500 had held since December. Rallies kept stalling at the falling 50 SMA, and the RSI stayed below 50. On January 29, a bearish engulfing candle closed at 84,515, at the bottom of the support area and well below the 50 SMA (89,811). By February 6, price had fallen to 60,500.
- Step 1 — Key level — support, resistance, a trendline or a round number
- Step 2 — Indicators — trend direction, momentum, divergence or overbought/oversold readings
- Step 3 — Price action — the candle or breakout that shows the market acting on the level
The same three steps work for long and short setups. Only the direction changes.
🔵 USING CONFLUENCE FOR EXITS
Confluence is often discussed for entries, but it can be just as useful for deciding when to leave a trade.

ETH on the daily chart, June 2025. Price made a higher high at 2,880.51, above the May high of 2,736.66, while the RSI made a lower high (67.2 against 81.9). Two days later, on June 13, price closed at 2,579.64, below the 20 SMA. By June 22, ETH had fallen to 2,114.63.
- Warning — a bearish divergence shows that momentum is fading behind the new high
- Confirmation — a close below the short-term moving average shows that price has started to follow
- Action — many traders tighten stops on the warning and exit on the confirmation
A single warning sign is a reason to pay attention. Two different signs together are a reason to act.
🔵 WHEN SIGNALS DISAGREE
Disagreement between tools is information too. It often marks the setups that turn into false breakouts and whipsaws.

BTC on the daily chart, August 2025. On August 13, price closed at 123,354, above the July high of 123,140. The RSI, however, made a lower high (68.5 against 76.0). The next day price spiked to 124,420 and closed back below the level at 118,383. By September 1, BTC was at 107,255.
- The breakout came from structure alone; momentum did not confirm it
- A close back inside the range turned the breakout into a fakeout
- Traders who required momentum to agree could have skipped the trade entirely
When your tools disagree, the usual choices are to wait, to trade a smaller size, or to pass. Each of those tends to cost less than a whipsaw.
🔵 CONFLUENCE AND RISK: THE DAILY-ONLY PLAN
A confluence setup also tells you where the trade is wrong and where it may be heading. Here is the opening setup, planned using the daily chart alone.

Entry on the close of the daily confluence candle at 64,472. Stop below the support area at 61,900. Target at the next daily resistance, the May 2026 high of 82,791. Risk of 2,572 points for a reward of 18,319 — a ratio of about 1 : 7.1. Price reached the target on September 21.
- Stop — beyond the level that the setup depends on; if that level breaks, the reasons for the trade are gone
- Target — the next opposing level, not a random percentage
- Size — the distance to the stop decides the position size, not the strength of the signal
This is a solid plan. But the daily candle closes late, and the stop has to sit below the whole support area. The next section shows how a lower timeframe can improve both.
🔵 TOP-DOWN CONFLUENCE: FROM THE DAILY MAP TO THE 4H TRIGGER
Each timeframe has a job. The higher timeframe draws the map; the lower timeframe chooses the moment.
- Daily — the map — the key level, the trend and the momentum bias; it answers where and which way
- 4H — the trigger — the exact candle where price reacts at that level; it answers when and how tight
A common pairing keeps a ratio of about 4 to 6 between timeframes: daily with 4H, 4H with 1H, 1H with 15 minutes.

The same support area on the 4-hour chart. Price spent August 14–16 compressing inside the daily support, with the 4H RSI between 33 and 44. Late on August 16, price dipped to 62,660, below the lows of the previous two days, and found buyers. The next 4H candle, August 17 at 00:00, engulfed the dip and closed at 63,362, lifting the 4H RSI from 36.9 to 53.7.
What the lower timeframe added:
- A sweep — the dip below the 2-day lows cleared out nearby stops and showed that sellers could not hold price lower
- A trigger — a bullish engulfing candle and a 4H RSI cross above 50, both inside the daily support
- A precise invalidation — if price returns below the sweep low, the 4H idea is wrong, even if the daily area is still intact

The same trade, timed on the 4H chart. Entry at 63,362, stop below the sweep at 62,600, and the same daily target at 82,791. Risk of 762 points for a reward of 19,429 — a ratio of about 1 : 25.5. After entry, the deepest dip was 63,225, just 137 points below the entry price, before the move began.
Compared with the daily-only plan, the target did not change. The risk did: the stop was about 3.4 times smaller, so the same move produced a much larger multiple of the risk.
A few honest caveats:
- Tight stops are hit more often — a lower-timeframe trigger can fail, and it may take more than one attempt inside the same daily area
- Near-zero drawdown is the ideal case — it happens when the trigger lands close to the turn, not on every trade
- Risk stays fixed in money — a smaller stop means a larger position for the same risk, so position size has to be calculated, not guessed
- The daily bias leads — a 4H trigger against the daily trend is a different, lower-quality trade
🐳 Pro Tip: Do not drop to the lower timeframe until price is already inside the higher-timeframe level. Hunting for 4H triggers in the middle of nowhere turns a clean method into overtrading.
🔵 A CONFLUENCE CHECKLIST
One way to put all of this into practice is to score each setup before entry:
- Level — is price at a clear higher-timeframe support or resistance?
- Trend — does the moving average point in the trade's direction?
- Momentum — does the RSI or MACD agree, without divergence against the trade?
- Trigger — is there a confirming candle on the entry timeframe?
- Invalidation — is there a clear lower-timeframe low or high for the stop?
- Room — is the next higher-timeframe level far enough for a reasonable ratio?
Many traders require at least four of these before entering. The exact number matters less than writing it down and using it consistently.
🔵 COMMON MISTAKES TO AVOID
- Counting tools from the same family as separate confirmations
- Adding indicators until something agrees with the trade you already want
- Taking lower-timeframe triggers that go against the higher-timeframe bias
- Placing a tight stop without recalculating position size
- Waiting for so many signals that the move is over before you enter
- Ignoring the one signal that disagrees
- Treating confluence as certainty and skipping the stop
🐳 PRO TIPS
- Start with the higher-timeframe level, then the indicators, then the lower-timeframe trigger, in that order
- Keep your chart to one tool per family; a clean chart is easier to read under pressure
- Set the target on the higher timeframe and the stop on the lower one; that is where large ratios usually come from
- Backtest your checklist on past charts before trading it, and note which combinations work on your market
- Keep a journal entry for every setup you skip — the trades you avoid are part of the result
Confluence is less about finding more signals and more about requiring agreement from the right ones, on the right timeframes. Which combination do you use most often? Share it in the comments.
Trading Essentials Series
MACD: Reading Momentum the Right Way
Chart Patterns: Reading the Shape of Price
Moving Averages: Choosing the Right One
RSI: Reading Momentum Beyond 70 and 30
Support & Resistance: Drawing Levels That Matter
Best Regards, BigBeluga 🐳
Difficulty: Intermediate
Most indicators give a signal on their own, and few of those signals are worth trading alone. Confluence is the habit of waiting until several different kinds of evidence point the same way — a level, a trend, momentum and a candle — before acting. This lesson goes one step further: it shows how to build that agreement on a higher timeframe, then drop to a lower timeframe to time the entry, so the stop can be tight while the target stays far away.
BTC on the daily chart, August 2026. Price had built a support area around 62,200–62,900 for three weeks. On August 17, a bullish engulfing candle formed on that support, closed back above the 50 SMA, and lifted the RSI from 41.8 to 54.3. Four independent signals on one candle. Within four days, price reached 79,511.
🔵 THE IDEA BEHIND CONFLUENCE
Every tool on a chart answers one question. A level answers where. A moving average answers which way. An oscillator answers how strong. A candle answers what buyers and sellers did right now. A lower timeframe answers exactly when.
When those answers agree, a setup tends to be cleaner:
- Fewer false signals — a signal that needs agreement from other tools is harder to trigger by noise
- Better discipline — a written list of conditions leaves less room for impulse entries
- Clearer risk — a setup built on a level gives the stop an obvious home
Confluence does not make a trade certain. It raises the quality of the setups you take, and it gives you a clear reason to skip the rest.
🔵 FIVE FAMILIES OF EVIDENCE
The key word in confluence is different. It helps to sort your tools into families and use, at most, one from each:
- Structure — support, resistance, trendlines, round numbers
- Trend — moving averages, higher highs and higher lows
- Momentum — RSI, MACD, stochastic
- Volatility — Bollinger Bands, ATR
- Participation — volume
A setup with one signal from three families usually says more than a setup with three signals from one family.
🐳 Pro Tip: Before adding a new indicator, ask which family it belongs to. If that family is already on your chart, the new tool is likely to repeat what you already see.
🔵 TOOLS THAT REPEAT EACH OTHER
Some popular combinations look like confluence but measure the same thing twice.
ETH on the daily chart with Bollinger Bands and a 20 SMA. The thick blue line is the 20 SMA; the orange line on top of it is the Bollinger basis. They are the same calculation, so a bounce from one is the same event as a bounce from the other.
- Moving averages and Bollinger Bands — the Bollinger basis is a moving average, so a touch of the basis and a touch of the 20 SMA are one signal
- MACD and RSI — both measure momentum from closing prices, so they tend to turn together; when both flip bullish, that is usually one piece of evidence seen twice
A quick test: if two tools are built from the same input and answer the same question, count them as one.
🔵 SETUP 1: TREND + MOMENTUM
This combination pairs a trend filter with a momentum trigger.
XRP on the daily chart, September 2026. Price stayed above the rising 50 SMA, and the pullback low on September 16 (1.2461) held just above it. The RSI dipped to 45.1 during the pullback, then crossed back above 50 on September 18, when price closed at 1.3961. Five days later, price reached 1.6578.
- Trend — price above a rising 50-period moving average
- Momentum — RSI crossing back above 50 after a pullback
- Location — the pullback holds near the moving average instead of breaking it
Aggressive traders may enter on the close of the RSI cross. Conservative traders often wait for the next candle to hold above the high of the pullback.
A variation of the same idea uses the MACD: a bullish crossover above the zero line, confirmed by rising volume. The logic is the same — trend, then momentum, then participation.
🔵 SETUP 2: VOLATILITY + PRICE ACTION
Volatility tools do not tell you direction. They tell you when a large move is becoming more likely. A candle pattern can supply the direction.
SOL on the 4-hour chart, August 2026. The Bollinger Bands narrowed into a tight squeeze. A bullish engulfing candle formed at the lower band, and the bands began to expand upward soon after. Price moved from 75.44 to 87.28 within three days.
- The squeeze — narrow bands show that volatility is unusually low, which often comes before expansion
- The candle — an engulfing or hammer at the edge of the range hints at which side is winning
- The expansion — bands opening in the direction of the candle confirm that the move has started
🐳 Pro Tip: A squeeze can break either way. Let the candle and the first expansion choose the direction for you instead of guessing in advance.
🔵 BUILDING CONFLUENCE IN THREE STEPS
Order matters. Starting with the level keeps the rest of the analysis anchored to a real price.
BTC on the daily chart, January 2026. A support area near 84,400–86,500 had held since December. Rallies kept stalling at the falling 50 SMA, and the RSI stayed below 50. On January 29, a bearish engulfing candle closed at 84,515, at the bottom of the support area and well below the 50 SMA (89,811). By February 6, price had fallen to 60,500.
- Step 1 — Key level — support, resistance, a trendline or a round number
- Step 2 — Indicators — trend direction, momentum, divergence or overbought/oversold readings
- Step 3 — Price action — the candle or breakout that shows the market acting on the level
The same three steps work for long and short setups. Only the direction changes.
🔵 USING CONFLUENCE FOR EXITS
Confluence is often discussed for entries, but it can be just as useful for deciding when to leave a trade.
ETH on the daily chart, June 2025. Price made a higher high at 2,880.51, above the May high of 2,736.66, while the RSI made a lower high (67.2 against 81.9). Two days later, on June 13, price closed at 2,579.64, below the 20 SMA. By June 22, ETH had fallen to 2,114.63.
- Warning — a bearish divergence shows that momentum is fading behind the new high
- Confirmation — a close below the short-term moving average shows that price has started to follow
- Action — many traders tighten stops on the warning and exit on the confirmation
A single warning sign is a reason to pay attention. Two different signs together are a reason to act.
🔵 WHEN SIGNALS DISAGREE
Disagreement between tools is information too. It often marks the setups that turn into false breakouts and whipsaws.
BTC on the daily chart, August 2025. On August 13, price closed at 123,354, above the July high of 123,140. The RSI, however, made a lower high (68.5 against 76.0). The next day price spiked to 124,420 and closed back below the level at 118,383. By September 1, BTC was at 107,255.
- The breakout came from structure alone; momentum did not confirm it
- A close back inside the range turned the breakout into a fakeout
- Traders who required momentum to agree could have skipped the trade entirely
When your tools disagree, the usual choices are to wait, to trade a smaller size, or to pass. Each of those tends to cost less than a whipsaw.
🔵 CONFLUENCE AND RISK: THE DAILY-ONLY PLAN
A confluence setup also tells you where the trade is wrong and where it may be heading. Here is the opening setup, planned using the daily chart alone.
Entry on the close of the daily confluence candle at 64,472. Stop below the support area at 61,900. Target at the next daily resistance, the May 2026 high of 82,791. Risk of 2,572 points for a reward of 18,319 — a ratio of about 1 : 7.1. Price reached the target on September 21.
- Stop — beyond the level that the setup depends on; if that level breaks, the reasons for the trade are gone
- Target — the next opposing level, not a random percentage
- Size — the distance to the stop decides the position size, not the strength of the signal
This is a solid plan. But the daily candle closes late, and the stop has to sit below the whole support area. The next section shows how a lower timeframe can improve both.
🔵 TOP-DOWN CONFLUENCE: FROM THE DAILY MAP TO THE 4H TRIGGER
Each timeframe has a job. The higher timeframe draws the map; the lower timeframe chooses the moment.
- Daily — the map — the key level, the trend and the momentum bias; it answers where and which way
- 4H — the trigger — the exact candle where price reacts at that level; it answers when and how tight
A common pairing keeps a ratio of about 4 to 6 between timeframes: daily with 4H, 4H with 1H, 1H with 15 minutes.
The same support area on the 4-hour chart. Price spent August 14–16 compressing inside the daily support, with the 4H RSI between 33 and 44. Late on August 16, price dipped to 62,660, below the lows of the previous two days, and found buyers. The next 4H candle, August 17 at 00:00, engulfed the dip and closed at 63,362, lifting the 4H RSI from 36.9 to 53.7.
What the lower timeframe added:
- A sweep — the dip below the 2-day lows cleared out nearby stops and showed that sellers could not hold price lower
- A trigger — a bullish engulfing candle and a 4H RSI cross above 50, both inside the daily support
- A precise invalidation — if price returns below the sweep low, the 4H idea is wrong, even if the daily area is still intact
The same trade, timed on the 4H chart. Entry at 63,362, stop below the sweep at 62,600, and the same daily target at 82,791. Risk of 762 points for a reward of 19,429 — a ratio of about 1 : 25.5. After entry, the deepest dip was 63,225, just 137 points below the entry price, before the move began.
Compared with the daily-only plan, the target did not change. The risk did: the stop was about 3.4 times smaller, so the same move produced a much larger multiple of the risk.
A few honest caveats:
- Tight stops are hit more often — a lower-timeframe trigger can fail, and it may take more than one attempt inside the same daily area
- Near-zero drawdown is the ideal case — it happens when the trigger lands close to the turn, not on every trade
- Risk stays fixed in money — a smaller stop means a larger position for the same risk, so position size has to be calculated, not guessed
- The daily bias leads — a 4H trigger against the daily trend is a different, lower-quality trade
🐳 Pro Tip: Do not drop to the lower timeframe until price is already inside the higher-timeframe level. Hunting for 4H triggers in the middle of nowhere turns a clean method into overtrading.
🔵 A CONFLUENCE CHECKLIST
One way to put all of this into practice is to score each setup before entry:
- Level — is price at a clear higher-timeframe support or resistance?
- Trend — does the moving average point in the trade's direction?
- Momentum — does the RSI or MACD agree, without divergence against the trade?
- Trigger — is there a confirming candle on the entry timeframe?
- Invalidation — is there a clear lower-timeframe low or high for the stop?
- Room — is the next higher-timeframe level far enough for a reasonable ratio?
Many traders require at least four of these before entering. The exact number matters less than writing it down and using it consistently.
🔵 COMMON MISTAKES TO AVOID
- Counting tools from the same family as separate confirmations
- Adding indicators until something agrees with the trade you already want
- Taking lower-timeframe triggers that go against the higher-timeframe bias
- Placing a tight stop without recalculating position size
- Waiting for so many signals that the move is over before you enter
- Ignoring the one signal that disagrees
- Treating confluence as certainty and skipping the stop
🐳 PRO TIPS
- Start with the higher-timeframe level, then the indicators, then the lower-timeframe trigger, in that order
- Keep your chart to one tool per family; a clean chart is easier to read under pressure
- Set the target on the higher timeframe and the stop on the lower one; that is where large ratios usually come from
- Backtest your checklist on past charts before trading it, and note which combinations work on your market
- Keep a journal entry for every setup you skip — the trades you avoid are part of the result
Confluence is less about finding more signals and more about requiring agreement from the right ones, on the right timeframes. Which combination do you use most often? Share it in the comments.
Trading Essentials Series
MACD: Reading Momentum the Right Way
Chart Patterns: Reading the Shape of Price
Moving Averages: Choosing the Right One
RSI: Reading Momentum Beyond 70 and 30
Support & Resistance: Drawing Levels That Matter
Best Regards, BigBeluga 🐳

🌐 bigbeluga.org/tv - Get access to our powerful tools & indicators.
🔵 Learn More -> docs.bigbeluga.org/
🔵 Join Discord -> go.bigbeluga.org/k65q9bfqfu
All content provided by BigBeluga is for educational purposes only
🔵 Learn More -> docs.bigbeluga.org/
🔵 Join Discord -> go.bigbeluga.org/k65q9bfqfu
All content provided by BigBeluga is for educational purposes only
การนำเสนอที่เกี่ยวข้อง
คำจำกัดสิทธิ์ความรับผิดชอบ
ข้อมูลและบทความไม่ได้มีวัตถุประสงค์เพื่อก่อให้เกิดกิจกรรมทางการเงิน, การลงทุน, การซื้อขาย, ข้อเสนอแนะ หรือคำแนะนำประเภทอื่น ๆ ที่ให้หรือรับรองโดย TradingView อ่านเพิ่มเติมใน ข้อกำหนดการใช้งาน