
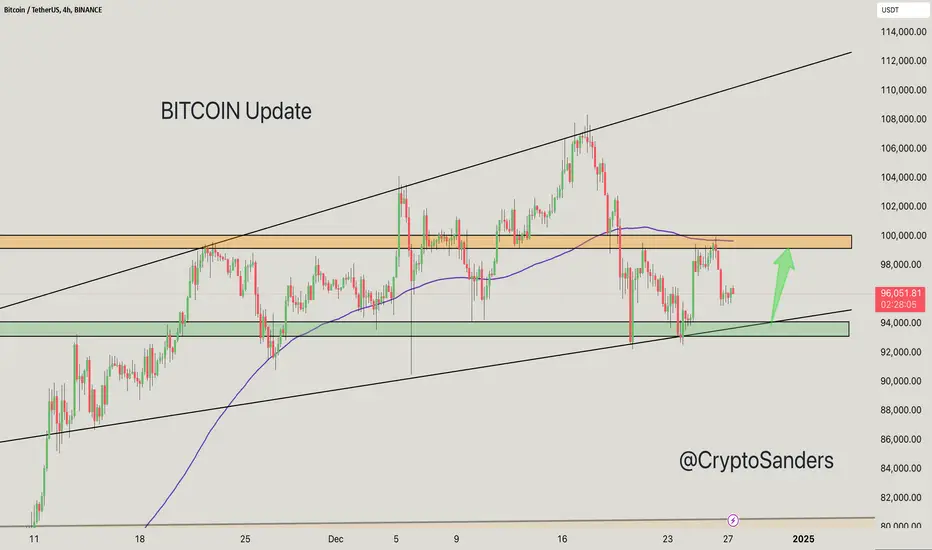
BTC appears to be trading within an ascending channel. The chart shows a bullish medium-term structure.
The price is currently testing the lower trendline support within the channel.
A crucial support area is marked between $94,000 – $92,000 (green area). This is a crucial level for a bounce.
Any break below this support could invalidate the channel and lead to further upward pressure.
Resistance lies around $100,000 – $102,000 (orange area), which has been tested multiple times.
A breakout above this level could spark a bullish push towards the upper trendline of the channel or new highs.
For updates on other coins or personalized insights, feel free to reach out via DM.
@Peter_CSAdmin

การนำเสนอที่เกี่ยวข้อง
คำจำกัดสิทธิ์ความรับผิดชอบ
ข้อมูลและบทความไม่ได้มีวัตถุประสงค์เพื่อก่อให้เกิดกิจกรรมทางการเงิน, การลงทุน, การซื้อขาย, ข้อเสนอแนะ หรือคำแนะนำประเภทอื่น ๆ ที่ให้หรือรับรองโดย TradingView อ่านเพิ่มเติมใน ข้อกำหนดการใช้งาน
การนำเสนอที่เกี่ยวข้อง
คำจำกัดสิทธิ์ความรับผิดชอบ
ข้อมูลและบทความไม่ได้มีวัตถุประสงค์เพื่อก่อให้เกิดกิจกรรมทางการเงิน, การลงทุน, การซื้อขาย, ข้อเสนอแนะ หรือคำแนะนำประเภทอื่น ๆ ที่ให้หรือรับรองโดย TradingView อ่านเพิ่มเติมใน ข้อกำหนดการใช้งาน