
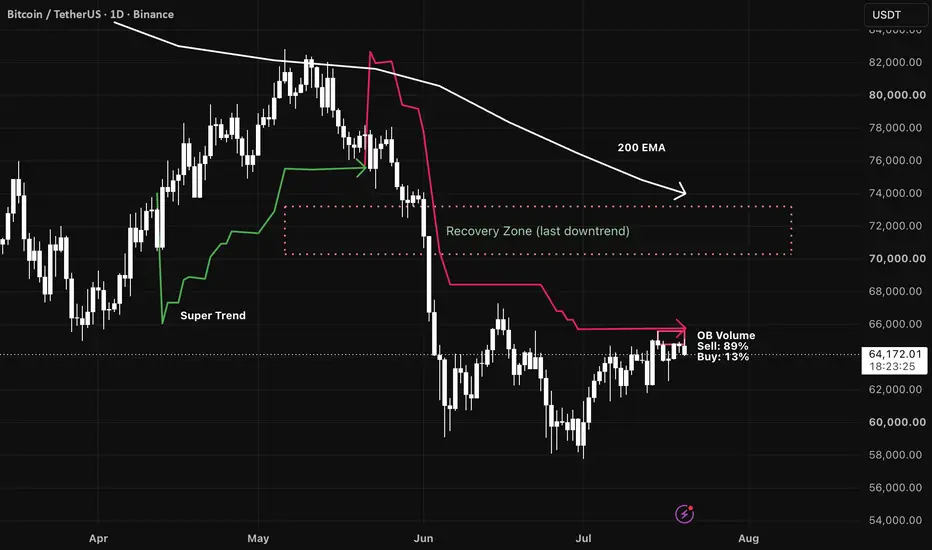
In this daily analysis of Bitcoin (BTC/USDT), we take a look at the current price action relative to key trend indicators and key resistance zones.
Key Technical Factors:
SuperTrend Indicator:
The SuperTrend flipped bearish in late May/early June after the strong drop from the $70k+ levels. The red trailing stop level currently sits around $66,000, acting as immediate dynamic resistance.
Order Book Volume Ratio (OB Volume):
At the current level, sell volume dominance is showing around 89% vs. 13% buy volume, highlighting significant selling pressure right near this dynamic SuperTrend resistance.
Recovery Zone (70k – 73k):
If BTC manages to break and hold above the current red SuperTrend line (~$66,000), the next major target area lies within the Recovery Zone ($70,000 – $73,000), which corresponds to the base of the previous major breakdown.
200 EMA:
The 200-day Exponential Moving Average is currently sloping downward above the price, adding a layer of long-term dynamic resistance above the 73k mark.
Scenario Breakdown:
Bearish / Rejection Scenario:
As long as price remains capped under the $66,000 SuperTrend line and heavy selling volume persists, a rejection back toward local support levels ($60,000 – $58,000) remains a strong possibility.
Bullish Confirmation:
A daily candle close above $66,000 would invalidate the short-term bearish SuperTrend and open up a potential move toward the $70,000 – $73,000 Recovery Zone.
Disclaimer: This analysis is for educational purposes only and does not constitute financial advice. Always manage your risk according to your trading strategy.
Key Technical Factors:
SuperTrend Indicator:
The SuperTrend flipped bearish in late May/early June after the strong drop from the $70k+ levels. The red trailing stop level currently sits around $66,000, acting as immediate dynamic resistance.
Order Book Volume Ratio (OB Volume):
At the current level, sell volume dominance is showing around 89% vs. 13% buy volume, highlighting significant selling pressure right near this dynamic SuperTrend resistance.
Recovery Zone (70k – 73k):
If BTC manages to break and hold above the current red SuperTrend line (~$66,000), the next major target area lies within the Recovery Zone ($70,000 – $73,000), which corresponds to the base of the previous major breakdown.
200 EMA:
The 200-day Exponential Moving Average is currently sloping downward above the price, adding a layer of long-term dynamic resistance above the 73k mark.
Scenario Breakdown:
Bearish / Rejection Scenario:
As long as price remains capped under the $66,000 SuperTrend line and heavy selling volume persists, a rejection back toward local support levels ($60,000 – $58,000) remains a strong possibility.
Bullish Confirmation:
A daily candle close above $66,000 would invalidate the short-term bearish SuperTrend and open up a potential move toward the $70,000 – $73,000 Recovery Zone.
Disclaimer: This analysis is for educational purposes only and does not constitute financial advice. Always manage your risk according to your trading strategy.

CH Invest and Trading
คำจำกัดสิทธิ์ความรับผิดชอบ
ข้อมูลและบทความไม่ได้มีวัตถุประสงค์เพื่อก่อให้เกิดกิจกรรมทางการเงิน, การลงทุน, การซื้อขาย, ข้อเสนอแนะ หรือคำแนะนำประเภทอื่น ๆ ที่ให้หรือรับรองโดย TradingView อ่านเพิ่มเติมใน ข้อกำหนดการใช้งาน
CH Invest and Trading
คำจำกัดสิทธิ์ความรับผิดชอบ
ข้อมูลและบทความไม่ได้มีวัตถุประสงค์เพื่อก่อให้เกิดกิจกรรมทางการเงิน, การลงทุน, การซื้อขาย, ข้อเสนอแนะ หรือคำแนะนำประเภทอื่น ๆ ที่ให้หรือรับรองโดย TradingView อ่านเพิ่มเติมใน ข้อกำหนดการใช้งาน