
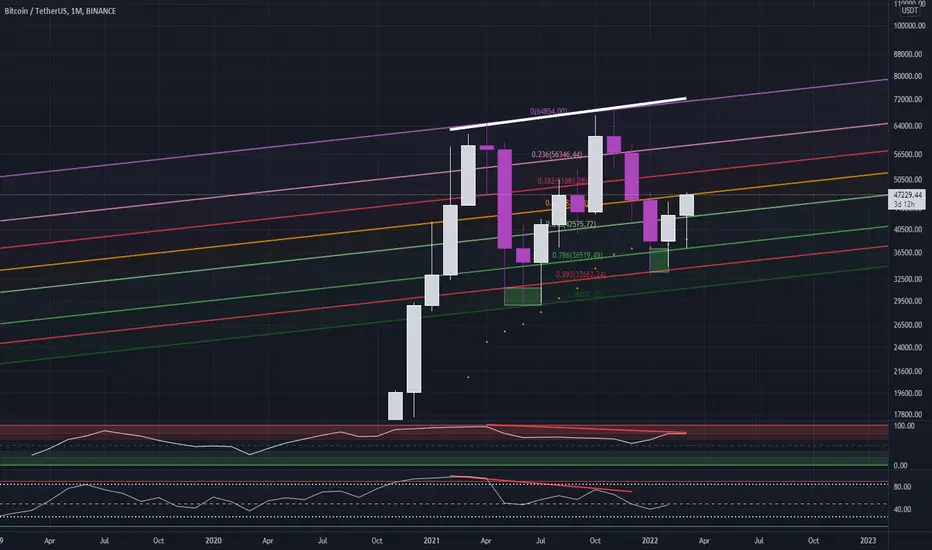
Hi guys I was looking at the weekly chart for bitcoin and I noticed something on the rsi. A huge hidden bearish divergence can be seen from last year's top to this year's top. I am still very bullish on bitcoin and do hope that this does not affect the price action of bitcoin in the following weeks to months even though we have had a massive break out to the 40k levels. Just a warning to be cautious. Just wanted to point that out in the case bitcoin dumps back down lower.
บันทึก
Apologies I meant the monthly chart not the weekly one. Thank you cschena123
บันทึก
However the hidden bearish can also be seen on the weekly chart as well!
การนำเสนอที่เกี่ยวข้อง
คำจำกัดสิทธิ์ความรับผิดชอบ
ข้อมูลและบทความไม่ได้มีวัตถุประสงค์เพื่อก่อให้เกิดกิจกรรมทางการเงิน, การลงทุน, การซื้อขาย, ข้อเสนอแนะ หรือคำแนะนำประเภทอื่น ๆ ที่ให้หรือรับรองโดย TradingView อ่านเพิ่มเติมใน ข้อกำหนดการใช้งาน
การนำเสนอที่เกี่ยวข้อง
คำจำกัดสิทธิ์ความรับผิดชอบ
ข้อมูลและบทความไม่ได้มีวัตถุประสงค์เพื่อก่อให้เกิดกิจกรรมทางการเงิน, การลงทุน, การซื้อขาย, ข้อเสนอแนะ หรือคำแนะนำประเภทอื่น ๆ ที่ให้หรือรับรองโดย TradingView อ่านเพิ่มเติมใน ข้อกำหนดการใช้งาน