
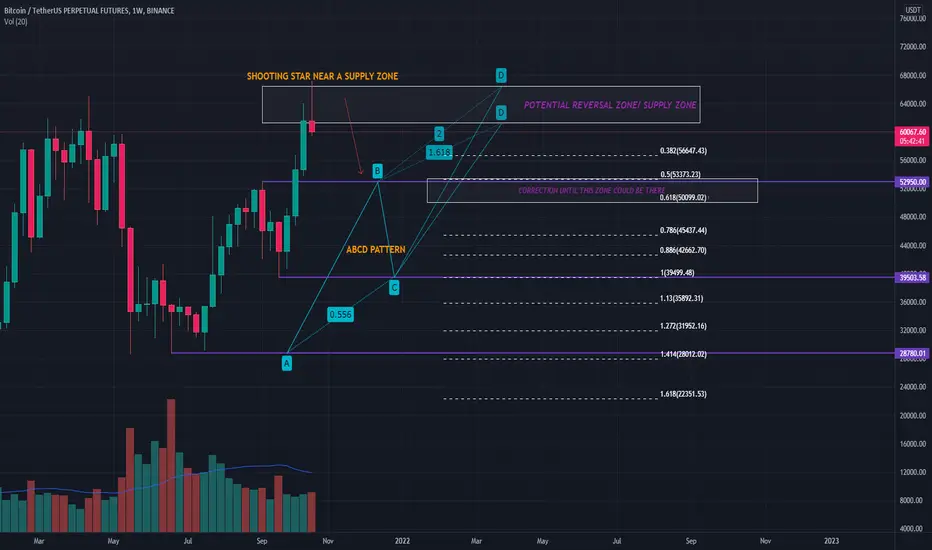
Here's the Bitcoin Usdt Perpetual weekly timeframe chart analysis. As the price is near the PRZ/supply zone set by the ABCD pattern, price action also seems to form a shooting star at the top of the supply zone.
This could be an early sign of exhaustion in the momentum and the price may correct further until the 53k-51k before another rally.
However, if the price crosses the 67K mark we can see the uptrend to be resuming again.
Happy trading :)
This is just for educational purposes.
This could be an early sign of exhaustion in the momentum and the price may correct further until the 53k-51k before another rally.
However, if the price crosses the 67K mark we can see the uptrend to be resuming again.
Happy trading :)
This is just for educational purposes.

การนำเสนอที่เกี่ยวข้อง
คำจำกัดสิทธิ์ความรับผิดชอบ
ข้อมูลและบทความไม่ได้มีวัตถุประสงค์เพื่อก่อให้เกิดกิจกรรมทางการเงิน, การลงทุน, การซื้อขาย, ข้อเสนอแนะ หรือคำแนะนำประเภทอื่น ๆ ที่ให้หรือรับรองโดย TradingView อ่านเพิ่มเติมใน ข้อกำหนดการใช้งาน
การนำเสนอที่เกี่ยวข้อง
คำจำกัดสิทธิ์ความรับผิดชอบ
ข้อมูลและบทความไม่ได้มีวัตถุประสงค์เพื่อก่อให้เกิดกิจกรรมทางการเงิน, การลงทุน, การซื้อขาย, ข้อเสนอแนะ หรือคำแนะนำประเภทอื่น ๆ ที่ให้หรือรับรองโดย TradingView อ่านเพิ่มเติมใน ข้อกำหนดการใช้งาน