

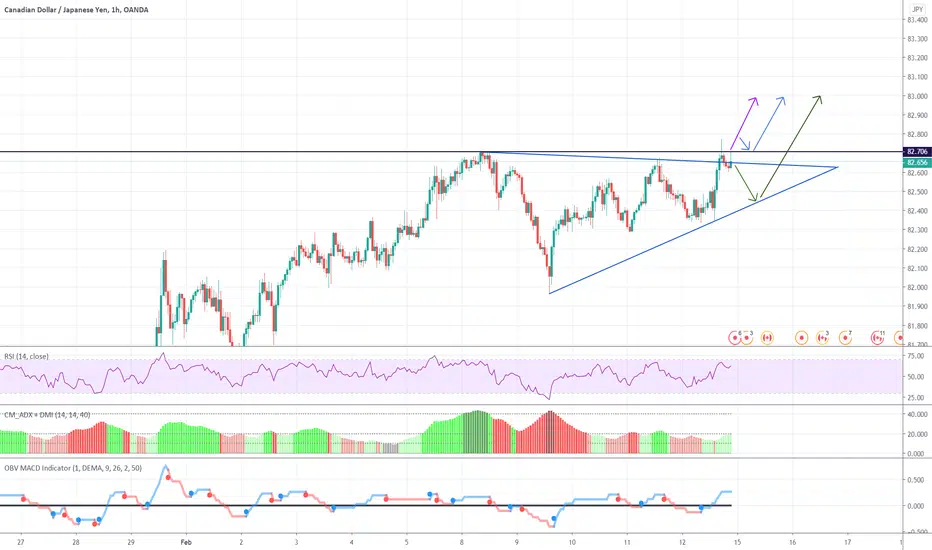
CADJPY possible long scenarios represented by the coloured arrows.
Scenario 1 (Green Arrow): we see a wedge pattern where it bounces of lower boundary to then make a move to the upside breaking out to resistance at 83.000 (psychological price level).
Scenario 2 (Blue Arrow): We see it break upper resistance (Black line), retest then move towards 83.000
Scenario 3: We watch for a breakout of upper resistance and a move towards 83.000
Looking at the moving average we see price in a upwards trend, hence the reason for not looking at taking a short
Scenario 1 (Green Arrow): we see a wedge pattern where it bounces of lower boundary to then make a move to the upside breaking out to resistance at 83.000 (psychological price level).
Scenario 2 (Blue Arrow): We see it break upper resistance (Black line), retest then move towards 83.000
Scenario 3: We watch for a breakout of upper resistance and a move towards 83.000
Looking at the moving average we see price in a upwards trend, hence the reason for not looking at taking a short
ปิดการเทรด: ถึงเป้าหมายการทำกำไร
Fantastic trade here, broke out to the upside
คำจำกัดสิทธิ์ความรับผิดชอบ
ข้อมูลและบทความไม่ได้มีวัตถุประสงค์เพื่อก่อให้เกิดกิจกรรมทางการเงิน, การลงทุน, การซื้อขาย, ข้อเสนอแนะ หรือคำแนะนำประเภทอื่น ๆ ที่ให้หรือรับรองโดย TradingView อ่านเพิ่มเติมใน ข้อกำหนดการใช้งาน
คำจำกัดสิทธิ์ความรับผิดชอบ
ข้อมูลและบทความไม่ได้มีวัตถุประสงค์เพื่อก่อให้เกิดกิจกรรมทางการเงิน, การลงทุน, การซื้อขาย, ข้อเสนอแนะ หรือคำแนะนำประเภทอื่น ๆ ที่ให้หรือรับรองโดย TradingView อ่านเพิ่มเติมใน ข้อกำหนดการใช้งาน