

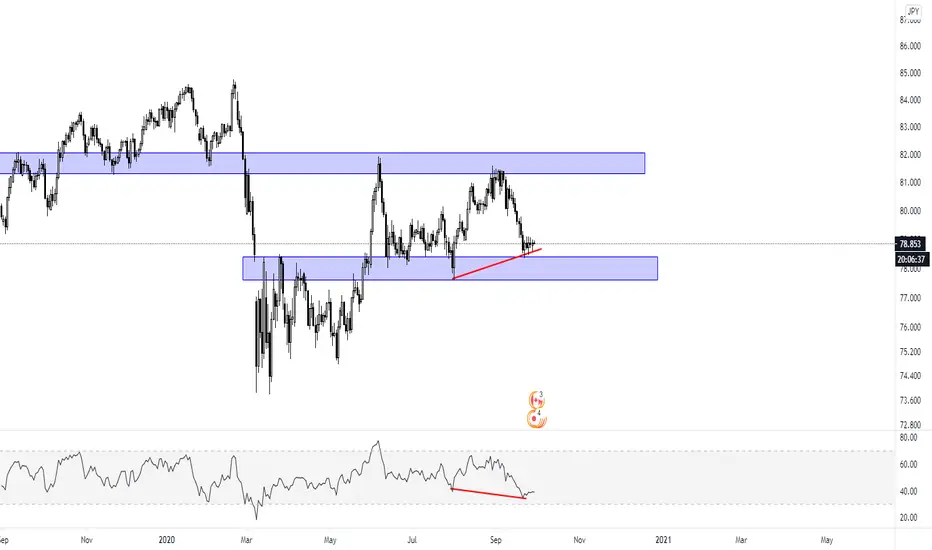
TOP DOWN ANALYSIS FOR CADJPY
บันทึก
On the daily timeframe, we can see that there was a massive fall around February and March and you have clearly seen that the two zones drawn are strong SR zones. SR standing for Support-Resistance.
Asides that, we have seen that the RSI has made lower lows towards its oversold level and price is making higher lows forming a bullish divergence.
บันทึก
On a 4 hour TimeFrame, we have seen that higher lows price was making which formed a bullish divergence has formed a good support level.
On the other hand, we can see that there is a downtrending trendline that has been broken.
บันทึก
On a 1 hour TimeFrame, besides seeing a visible trendline, we can see an ascending triangle formation in the marked yellow zone and RSI is also balanced on an ascending support level.
บันทึก
On a 30 minutes timeframe, we can see that there was a downtrending channel after the breakout from the downtrend.
The channel was broken and retested and now heading towards the red zone.
บันทึก
So what am I expecting?😃บันทึก
ONE
บันทึก
TWO
บันทึก
After the breakout and retest on the red zone, where will I put my take profit and Stop Loss to ensure proper risk management?บันทึก
Personally, I would buy at the price close above the red zone with my Stop Loss and take profit levels put into consideration.😊

คำจำกัดสิทธิ์ความรับผิดชอบ
ข้อมูลและบทความไม่ได้มีวัตถุประสงค์เพื่อก่อให้เกิดกิจกรรมทางการเงิน, การลงทุน, การซื้อขาย, ข้อเสนอแนะ หรือคำแนะนำประเภทอื่น ๆ ที่ให้หรือรับรองโดย TradingView อ่านเพิ่มเติมใน ข้อกำหนดการใช้งาน
คำจำกัดสิทธิ์ความรับผิดชอบ
ข้อมูลและบทความไม่ได้มีวัตถุประสงค์เพื่อก่อให้เกิดกิจกรรมทางการเงิน, การลงทุน, การซื้อขาย, ข้อเสนอแนะ หรือคำแนะนำประเภทอื่น ๆ ที่ให้หรือรับรองโดย TradingView อ่านเพิ่มเติมใน ข้อกำหนดการใช้งาน