Long
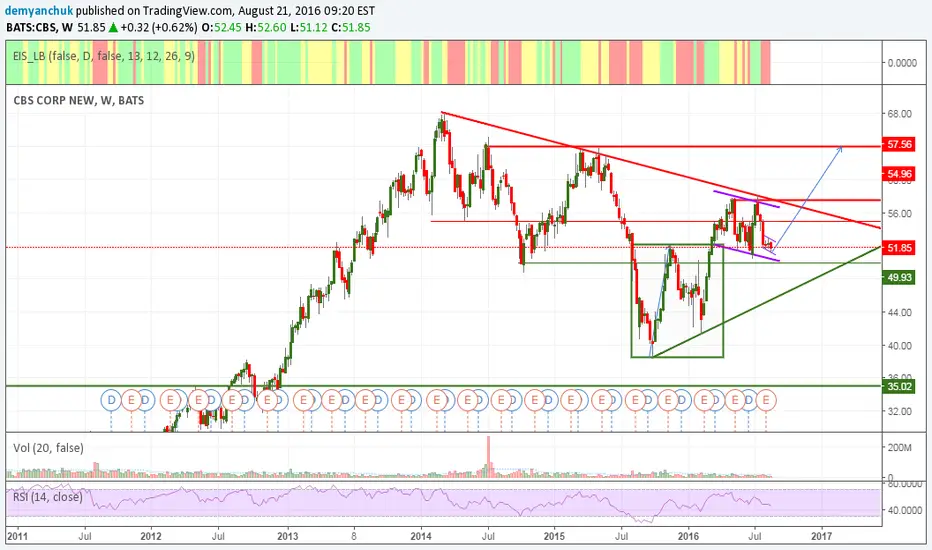
CBS: weekly chart supports daily consolidation
Signals:
weekly double bottom
weekly consolidation-flag under inclined resistance (we forecast its breakout because double bottom hasn't played itself yet)
daily consolidation-flag
Buy 53.00 (breakout of daily flag's top line)
Stop-loss 51.10 (-2 tics flag's low)
Long-term target 64.00 (sizing+horizontal resistance)
weekly double bottom
weekly consolidation-flag under inclined resistance (we forecast its breakout because double bottom hasn't played itself yet)
daily consolidation-flag
Buy 53.00 (breakout of daily flag's top line)
Stop-loss 51.10 (-2 tics flag's low)
Long-term target 64.00 (sizing+horizontal resistance)

คำจำกัดสิทธิ์ความรับผิดชอบ
ข้อมูลและบทความไม่ได้มีวัตถุประสงค์เพื่อก่อให้เกิดกิจกรรมทางการเงิน, การลงทุน, การซื้อขาย, ข้อเสนอแนะ หรือคำแนะนำประเภทอื่น ๆ ที่ให้หรือรับรองโดย TradingView อ่านเพิ่มเติมใน ข้อกำหนดการใช้งาน
คำจำกัดสิทธิ์ความรับผิดชอบ
ข้อมูลและบทความไม่ได้มีวัตถุประสงค์เพื่อก่อให้เกิดกิจกรรมทางการเงิน, การลงทุน, การซื้อขาย, ข้อเสนอแนะ หรือคำแนะนำประเภทอื่น ๆ ที่ให้หรือรับรองโดย TradingView อ่านเพิ่มเติมใน ข้อกำหนดการใช้งาน