Long
Stock of the Day / CGC
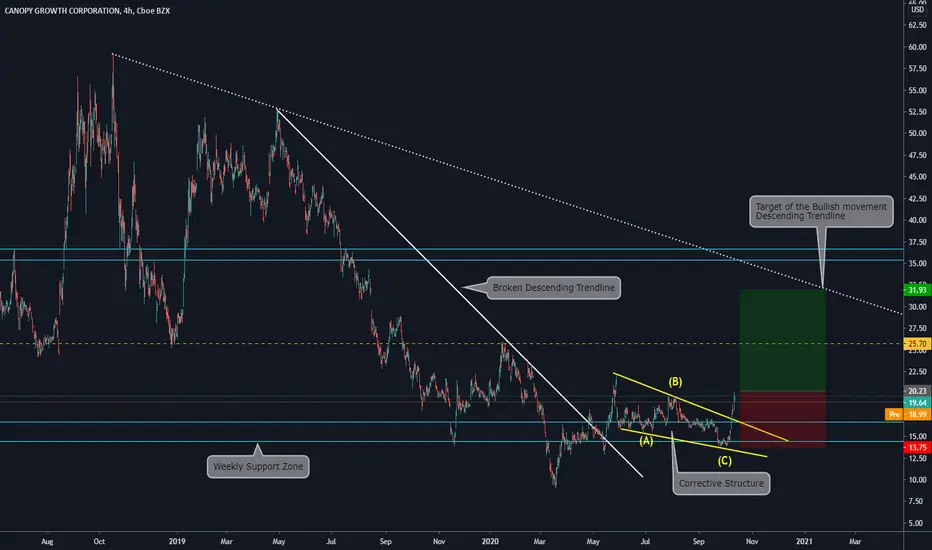
Today we have a long setup to share. As we are used to we will start by sharing the Macro view and then we will explain the 4hs chart
a) Weekly Chart: The price bounced from a clear Support / Resistance level tested from both sides

b) On the 4HS chart we can see a broken descending trendline + a clear corrective structure supported on the weekly level
c) The corrective structure is an ABC pattern which is considered a continuation structure
d) We have set our Orders as you can see on the chart. We will move our stop loss to break-even when the price reaches the yellow horizontal line
e) On this setup we will risk 1% of our capital and we expect to win 1.8%
f) We will cancel the setup IF the price goes below C
g) Remember: Trade safe, protect your capital, and always understand what you are doing!
a) Weekly Chart: The price bounced from a clear Support / Resistance level tested from both sides
b) On the 4HS chart we can see a broken descending trendline + a clear corrective structure supported on the weekly level
c) The corrective structure is an ABC pattern which is considered a continuation structure
d) We have set our Orders as you can see on the chart. We will move our stop loss to break-even when the price reaches the yellow horizontal line
e) On this setup we will risk 1% of our capital and we expect to win 1.8%
f) We will cancel the setup IF the price goes below C
g) Remember: Trade safe, protect your capital, and always understand what you are doing!

คำจำกัดสิทธิ์ความรับผิดชอบ
ข้อมูลและบทความไม่ได้มีวัตถุประสงค์เพื่อก่อให้เกิดกิจกรรมทางการเงิน, การลงทุน, การซื้อขาย, ข้อเสนอแนะ หรือคำแนะนำประเภทอื่น ๆ ที่ให้หรือรับรองโดย TradingView อ่านเพิ่มเติมใน ข้อกำหนดการใช้งาน
คำจำกัดสิทธิ์ความรับผิดชอบ
ข้อมูลและบทความไม่ได้มีวัตถุประสงค์เพื่อก่อให้เกิดกิจกรรมทางการเงิน, การลงทุน, การซื้อขาย, ข้อเสนอแนะ หรือคำแนะนำประเภทอื่น ๆ ที่ให้หรือรับรองโดย TradingView อ่านเพิ่มเติมใน ข้อกำหนดการใช้งาน