

Overview
---------------------------------------------------------------
Definition
---------------------------------------------------------------
Concept
---------------------------------------------------------------
Chart Explanation
---------------------------------------------------------------
Key Observations
---------------------------------------------------------------
Why It Matters[/b]
---------------------------------------------------------------
Conclusion
---------------------------------------------------------------
⚠️ Disclaimer
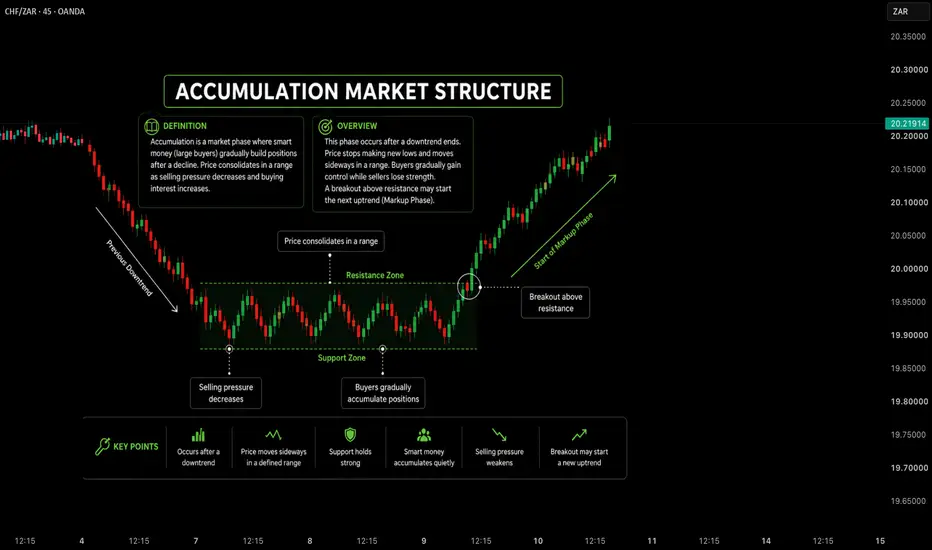
The Accumulation Market Structure typically develops after a sustained downtrend, where price shifts from declining into a period of sideways consolidation. During this phase, selling pressure gradually weakens while buying interest steadily increases, resulting in a well-defined trading range. As buyers begin to absorb available supply, the market establishes a stronger foundation. A confirmed breakout above resistance may indicate the transition into the Markup Phase although confirmation should always come from price action.
---------------------------------------------------------------
Definition
Accumulation is a market phase that typically develops after a prolonged downtrend, where price stops making lower lows and begins consolidating within a defined range. During this period, selling pressure gradually weakens while buying interest steadily increases, creating a temporary balance between supply and demand. A confirmed breakout above the consolidation range may indicate the beginning of a new bullish trend.
---------------------------------------------------------------
Concept
The Accumulation Market Structure represents a transition from a bearish trend into a period of consolidation. During this phase, selling pressure gradually weakens while buyers steadily absorb available supply. Price remains within a defined trading range as supply and demand move toward equilibrium. The accumulation phase concludes only when price confirms a breakout or breakdown from the established range.
---------------------------------------------------------------
Chart Explanation
- The chart begins with a clear bearish trend.
- Price then enters a sideways consolidation range.
- Support repeatedly attracts buying interest and prevents further declines.
- Resistance continues to cap upward price movement during consolidation.
- Multiple reactions at both boundaries validate the trading range.
- A confirmed breakout above resistance may signal the beginning of the **Markup Phase**.
---------------------------------------------------------------
Key Observations
- Selling pressure gradually weakens throughout the consolidation.
- Buyers continue to defend the established support zone.
- Price remains confined within a clearly defined trading range.
- The accumulation range reflects temporary equilibrium between buyers and sellers.
- The market structure remains neutral until a confirmed breakout or breakdown occurs.
---------------------------------------------------------------
Why It Matters[/b]
Understanding the Accumulation Market Structurehelps market participants identify periods where price transitions from a bearish trend into consolidation. Recognizing this phase improves the interpretation of support, resistance, and overall market structure. Waiting for breakout confirmation encourages a disciplined approach instead of anticipating a trend reversal too early.
---------------------------------------------------------------
Conclusion
The Accumulation Market Structure demonstrates how markets often stabilize after a decline before establishing their next directional move. As long as price remains within the consolidation range, support and resistance continue to define market behavior. A confirmed breakout above resistance may indicate the beginning of the **Markup Phase**, while continued consolidation suggests the market is still building a foundation.
---------------------------------------------------------------
⚠️ Disclaimer
📘 This publication is intended for educational purposes only.
🙅 Not SEBI registered.
❌ This is not a buy or sell recommendation.
🧠 Purely a learning resource focused on market structure and price action.
📊 Not Financial Advice.

Pine Script Developer • Market Analysis
คำจำกัดสิทธิ์ความรับผิดชอบ
ข้อมูลและบทความไม่ได้มีวัตถุประสงค์เพื่อก่อให้เกิดกิจกรรมทางการเงิน, การลงทุน, การซื้อขาย, ข้อเสนอแนะ หรือคำแนะนำประเภทอื่น ๆ ที่ให้หรือรับรองโดย TradingView อ่านเพิ่มเติมใน ข้อกำหนดการใช้งาน
Pine Script Developer • Market Analysis
คำจำกัดสิทธิ์ความรับผิดชอบ
ข้อมูลและบทความไม่ได้มีวัตถุประสงค์เพื่อก่อให้เกิดกิจกรรมทางการเงิน, การลงทุน, การซื้อขาย, ข้อเสนอแนะ หรือคำแนะนำประเภทอื่น ๆ ที่ให้หรือรับรองโดย TradingView อ่านเพิ่มเติมใน ข้อกำหนดการใช้งาน