
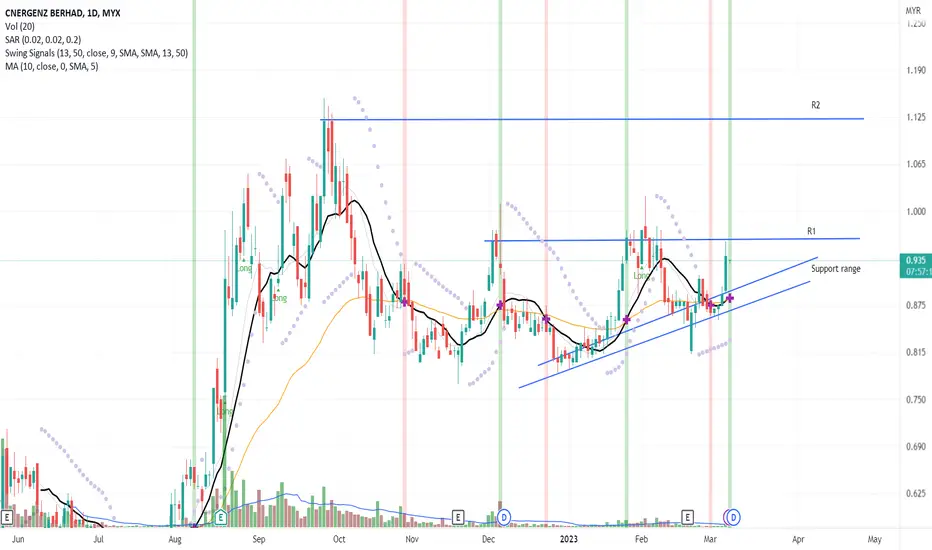
The candlestick pattern indicates the price has rebound from the price support range. Where the price gains momentum towards the R1. Although there was a significant price movement the result in volume is lower than the average volume. Hence, indicate an accumulated phase pattern but suggests that the long-term uptrend remains intact.
The MACD is in a divergence signal, thus, conforming with the candlestick trendline.
Let's save CNERGEN in WL and watch out for significant price movement with the volume above the average volume.
R 0.965
S 0.865
The MACD is in a divergence signal, thus, conforming with the candlestick trendline.
Let's save CNERGEN in WL and watch out for significant price movement with the volume above the average volume.
R 0.965
S 0.865

คำจำกัดสิทธิ์ความรับผิดชอบ
ข้อมูลและบทความไม่ได้มีวัตถุประสงค์เพื่อก่อให้เกิดกิจกรรมทางการเงิน, การลงทุน, การซื้อขาย, ข้อเสนอแนะ หรือคำแนะนำประเภทอื่น ๆ ที่ให้หรือรับรองโดย TradingView อ่านเพิ่มเติมใน ข้อกำหนดการใช้งาน
คำจำกัดสิทธิ์ความรับผิดชอบ
ข้อมูลและบทความไม่ได้มีวัตถุประสงค์เพื่อก่อให้เกิดกิจกรรมทางการเงิน, การลงทุน, การซื้อขาย, ข้อเสนอแนะ หรือคำแนะนำประเภทอื่น ๆ ที่ให้หรือรับรองโดย TradingView อ่านเพิ่มเติมใน ข้อกำหนดการใช้งาน