
COST (COSTCO) massively bearish head and shoulders pattern
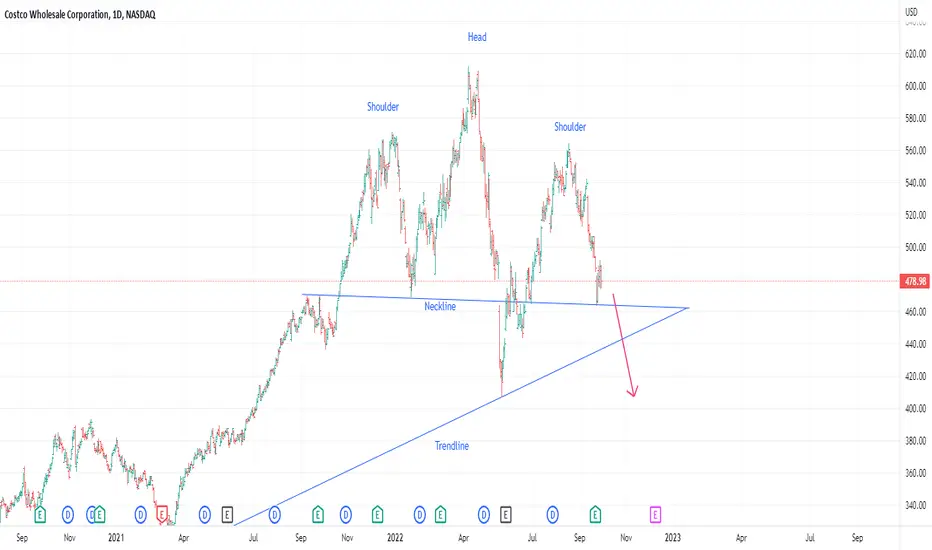
COST (COSTCO) has formed a massive head and shoulders pattern over the past year, which seems like a no-brainer opportunity to get short.
COST could possibly reach 440 by the middle of October and 407 by the first week of November if the price breaches the neckline around 464. A period of consolidation could delay these estimates by several days.
Disclaimer: I am not a financial advisor, and the above statements are not investment advice. My comments are only intended for educational purposes. You are solely responsible for your own trading decisions.
COST could possibly reach 440 by the middle of October and 407 by the first week of November if the price breaches the neckline around 464. A period of consolidation could delay these estimates by several days.
Disclaimer: I am not a financial advisor, and the above statements are not investment advice. My comments are only intended for educational purposes. You are solely responsible for your own trading decisions.
ปิดการเทรด ด้วยตนเอง
The price fell 9.03 short of my original prediction. It reached a low of 449.03 on October 22. Since then, the price has rallied. I'm still keeping an eye on it for a major move lower by the end of the year or early next year. I don't think this massive head and shoulders pattern is lying.
คำจำกัดสิทธิ์ความรับผิดชอบ
ข้อมูลและบทความไม่ได้มีวัตถุประสงค์เพื่อก่อให้เกิดกิจกรรมทางการเงิน, การลงทุน, การซื้อขาย, ข้อเสนอแนะ หรือคำแนะนำประเภทอื่น ๆ ที่ให้หรือรับรองโดย TradingView อ่านเพิ่มเติมใน ข้อกำหนดการใช้งาน
คำจำกัดสิทธิ์ความรับผิดชอบ
ข้อมูลและบทความไม่ได้มีวัตถุประสงค์เพื่อก่อให้เกิดกิจกรรมทางการเงิน, การลงทุน, การซื้อขาย, ข้อเสนอแนะ หรือคำแนะนำประเภทอื่น ๆ ที่ให้หรือรับรองโดย TradingView อ่านเพิ่มเติมใน ข้อกำหนดการใช้งาน