Long
Double Bottom Possibility
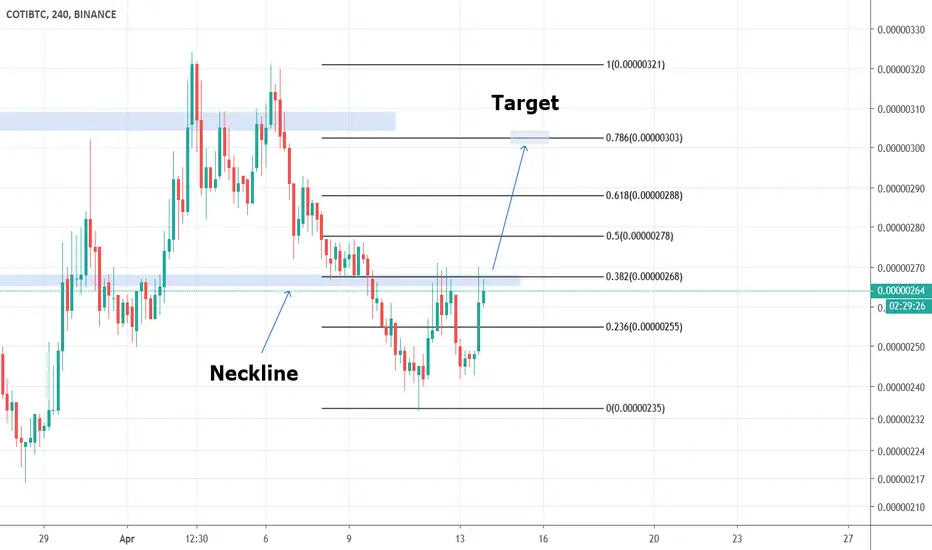
there is a possibility of forming a double bottom on the chart of $BINANCE:COTIBTC, the neckline is around 268-270 which has overlap with 0.38 fibo level and a static resistance.
if the neckline breaks by a strong candle, we can open a buy order.
The target of this double bottom pattern is around 300.
if the neckline breaks by a strong candle, we can open a buy order.
The target of this double bottom pattern is around 300.
ปิดการเทรด: ถึงเป้าหมายการทำกำไร
target reached nicelyThis is crypto Academi
follow us to get more call like this

คำจำกัดสิทธิ์ความรับผิดชอบ
ข้อมูลและบทความไม่ได้มีวัตถุประสงค์เพื่อก่อให้เกิดกิจกรรมทางการเงิน, การลงทุน, การซื้อขาย, ข้อเสนอแนะ หรือคำแนะนำประเภทอื่น ๆ ที่ให้หรือรับรองโดย TradingView อ่านเพิ่มเติมใน ข้อกำหนดการใช้งาน
คำจำกัดสิทธิ์ความรับผิดชอบ
ข้อมูลและบทความไม่ได้มีวัตถุประสงค์เพื่อก่อให้เกิดกิจกรรมทางการเงิน, การลงทุน, การซื้อขาย, ข้อเสนอแนะ หรือคำแนะนำประเภทอื่น ๆ ที่ให้หรือรับรองโดย TradingView อ่านเพิ่มเติมใน ข้อกำหนดการใช้งาน