
Technical Analysis
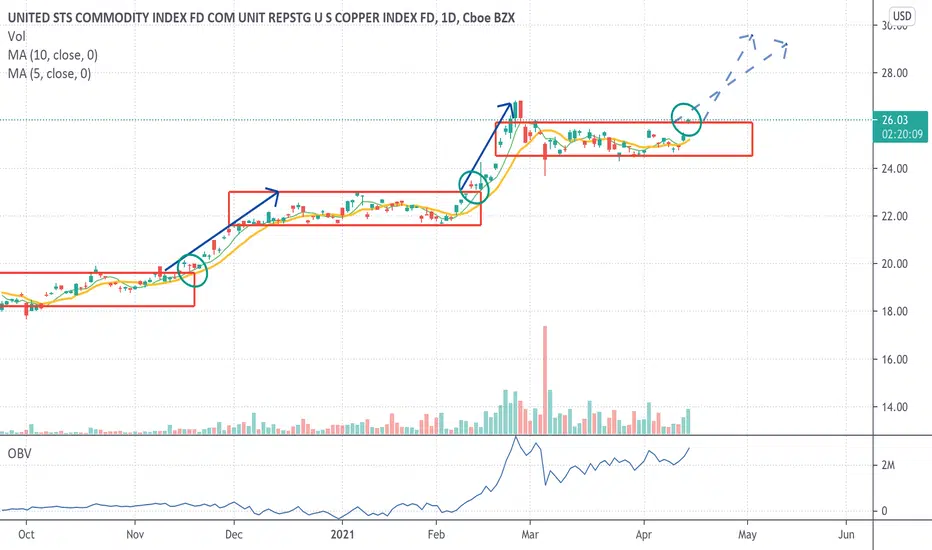
As you can see in the chart, every red square is showing a consolidation period, followed by a strong rally.
Today's action is showing strength as we are seeing a potential breakout, outside the 1-month consolidation period.
Trade setup
The light-blue arrows are potential measured moves. However, I would follow the 5sma or 10sma, as a stop-exit for 50% of your position.
Fundamental Analysis
There is some concern around inflation, all though the Fed maintains he believes it will be transitory.
Here is the way I follow inflation, which is a free chart by the Federal Reserve Economic Data:
fred.stlouisfed.org/series/T5YIE
Another way is with the TIP etf.
บันทึก
Since the breakout, we have made a test of the last consolidation range and bounce back higher.Chart is looking great.

การนำเสนอที่เกี่ยวข้อง
คำจำกัดสิทธิ์ความรับผิดชอบ
ข้อมูลและบทความไม่ได้มีวัตถุประสงค์เพื่อก่อให้เกิดกิจกรรมทางการเงิน, การลงทุน, การซื้อขาย, ข้อเสนอแนะ หรือคำแนะนำประเภทอื่น ๆ ที่ให้หรือรับรองโดย TradingView อ่านเพิ่มเติมใน ข้อกำหนดการใช้งาน
การนำเสนอที่เกี่ยวข้อง
คำจำกัดสิทธิ์ความรับผิดชอบ
ข้อมูลและบทความไม่ได้มีวัตถุประสงค์เพื่อก่อให้เกิดกิจกรรมทางการเงิน, การลงทุน, การซื้อขาย, ข้อเสนอแนะ หรือคำแนะนำประเภทอื่น ๆ ที่ให้หรือรับรองโดย TradingView อ่านเพิ่มเติมใน ข้อกำหนดการใช้งาน