You may notice that 
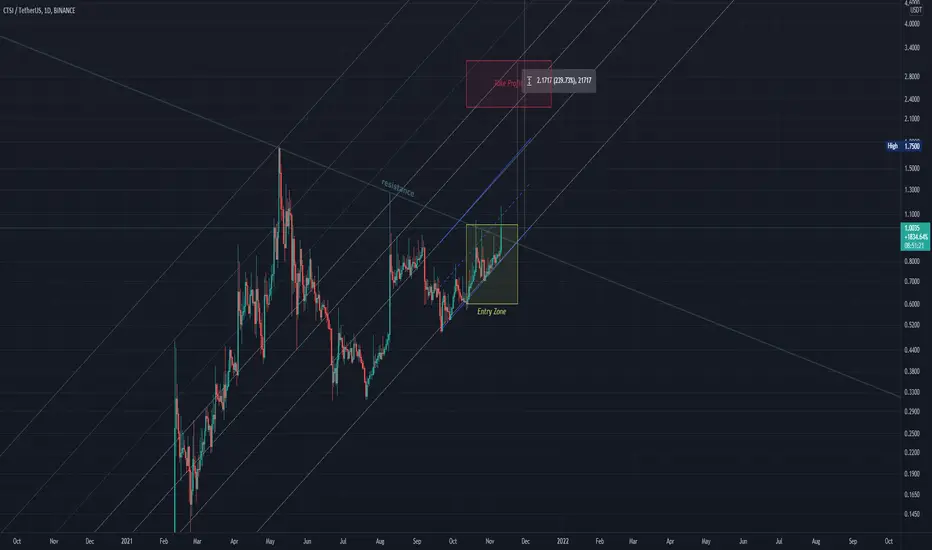
 CTSI has moved within a very distinct channel for the last year or so. By drawing Fibonacci channels, we can identify a few strong support/resistance levels.
I drew an entry zone which may be your only chance of getting in early before a potential run towards a 10 USDT valuation. Based on these channels, I'm confident in saying that CTSI is still a very early buy. However, I suggest waiting until CTSI hits its newly-formed support.
I also drew a blue channel representingCTSI's short-term movement. As you can see, it has had some difficulty breaking through that mid-range resistance.
What do you think of this analysis? Let me know!
CTSI has moved within a very distinct channel for the last year or so. By drawing Fibonacci channels, we can identify a few strong support/resistance levels.I drew an entry zone which may be your only chance of getting in early before a potential run towards a 10 USDT valuation. Based on these channels, I'm confident in saying that CTSI is still a very early buy. However, I suggest waiting until CTSI hits its newly-formed support.
I also drew a blue channel representing
CTSI's short-term movement. As you can see, it has had some difficulty breaking through that mid-range resistance.What do you think of this analysis? Let me know!

คำจำกัดสิทธิ์ความรับผิดชอบ
ข้อมูลและบทความไม่ได้มีวัตถุประสงค์เพื่อก่อให้เกิดกิจกรรมทางการเงิน, การลงทุน, การซื้อขาย, ข้อเสนอแนะ หรือคำแนะนำประเภทอื่น ๆ ที่ให้หรือรับรองโดย TradingView อ่านเพิ่มเติมใน ข้อกำหนดการใช้งาน
คำจำกัดสิทธิ์ความรับผิดชอบ
ข้อมูลและบทความไม่ได้มีวัตถุประสงค์เพื่อก่อให้เกิดกิจกรรมทางการเงิน, การลงทุน, การซื้อขาย, ข้อเสนอแนะ หรือคำแนะนำประเภทอื่น ๆ ที่ให้หรือรับรองโดย TradingView อ่านเพิ่มเติมใน ข้อกำหนดการใช้งาน