Long
CTXCUSDT
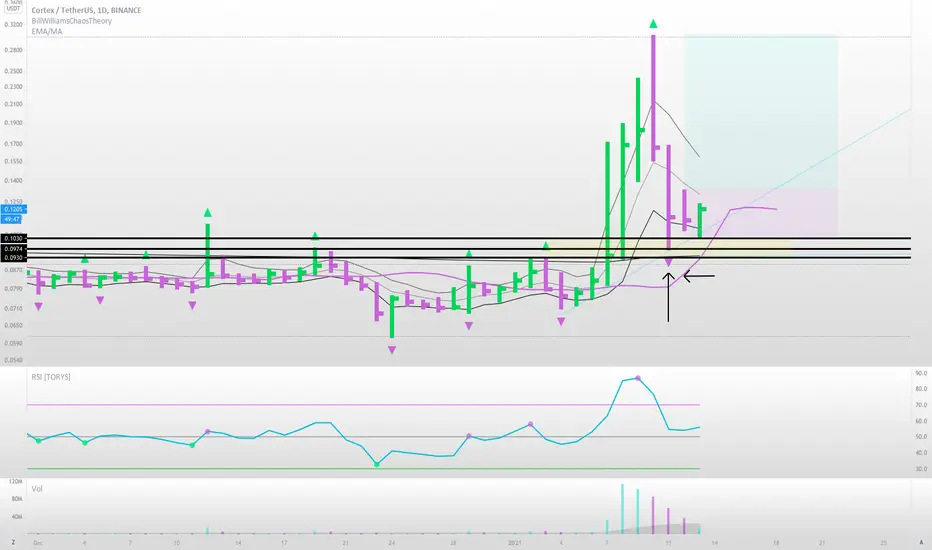
A volume diversion bar has formed on the daily chart. Fractal is above the 13ema and price has pushed into the high/low 5ema channel without crossing the high. Price is above the 200ema and RSI above 50, which tells us this is an up-trending market. The first target is the last fractal high or a volume diversion bar to the downside. A stop will be placed below the prior daily candle 13-01-2021. Enter on today's candle 14-01-2021. Good luck!
บันทึก
Price targets are just a guide. Please watch for a change in market sentiment!บันทึก
Target !. บันทึก
Comment: If angulation remains strong - doesn't slip between dashed lines and price pulls further away, remain in the trade! angulation is very important! This could be a widening wedge pattern and could actually see price slip to the downside. Take profit and move your stop loss up at the end of each daily candle.บันทึก
Move your stop to breakeven!บันทึก
4hr ปิดการเทรด ด้วยตนเอง
บันทึก
All trades are still active. Ignore the comment above -บันทึก
ปิดการเทรด: ถึงเป้าหมายการตัดขาดทุน

คำจำกัดสิทธิ์ความรับผิดชอบ
ข้อมูลและบทความไม่ได้มีวัตถุประสงค์เพื่อก่อให้เกิดกิจกรรมทางการเงิน, การลงทุน, การซื้อขาย, ข้อเสนอแนะ หรือคำแนะนำประเภทอื่น ๆ ที่ให้หรือรับรองโดย TradingView อ่านเพิ่มเติมใน ข้อกำหนดการใช้งาน
คำจำกัดสิทธิ์ความรับผิดชอบ
ข้อมูลและบทความไม่ได้มีวัตถุประสงค์เพื่อก่อให้เกิดกิจกรรมทางการเงิน, การลงทุน, การซื้อขาย, ข้อเสนอแนะ หรือคำแนะนำประเภทอื่น ๆ ที่ให้หรือรับรองโดย TradingView อ่านเพิ่มเติมใน ข้อกำหนดการใช้งาน