Weekly Chart :

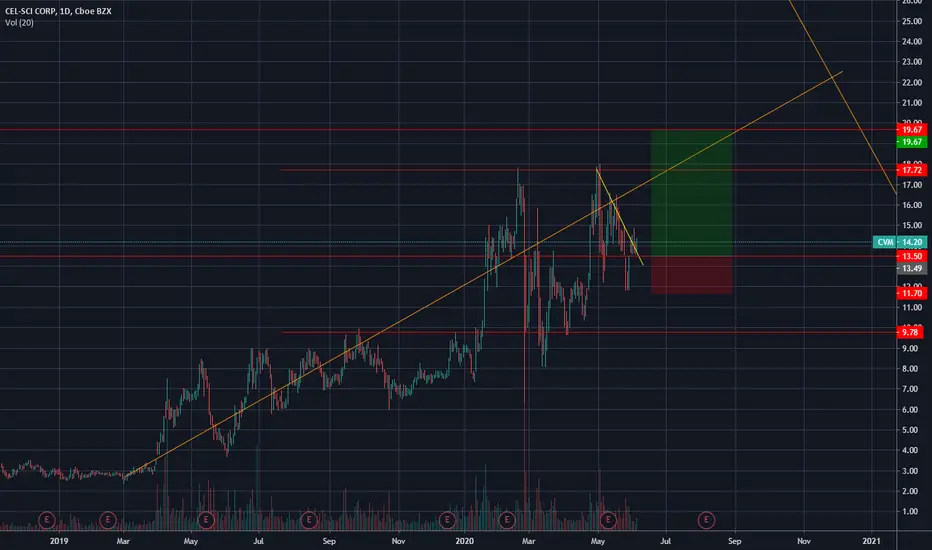
 CVM Finished the Major Down Trend on April 2019, and from then is in a solid Secondary Up Trend.
Note 13.50 Historical level, which serve us as a good support to form a trade.
Daily Chart :

Minor Down Trend about to end (Yellow):

Line Chart :

The Trade Plan :

Wait for a Clear Bullish Minor sign -
1. Strong buying Candle on 13.50 Level .
2. Retest of the Orange Trendline and closing above the Yellow Trendline.
CVM Finished the Major Down Trend on April 2019, and from then is in a solid Secondary Up Trend.Note 13.50 Historical level, which serve us as a good support to form a trade.
Daily Chart :
Minor Down Trend about to end (Yellow):
Line Chart :
The Trade Plan :
Wait for a Clear Bullish Minor sign -
1. Strong buying Candle on 13.50 Level .
2. Retest of the Orange Trendline and closing above the Yellow Trendline.

คำจำกัดสิทธิ์ความรับผิดชอบ
ข้อมูลและบทความไม่ได้มีวัตถุประสงค์เพื่อก่อให้เกิดกิจกรรมทางการเงิน, การลงทุน, การซื้อขาย, ข้อเสนอแนะ หรือคำแนะนำประเภทอื่น ๆ ที่ให้หรือรับรองโดย TradingView อ่านเพิ่มเติมใน ข้อกำหนดการใช้งาน
คำจำกัดสิทธิ์ความรับผิดชอบ
ข้อมูลและบทความไม่ได้มีวัตถุประสงค์เพื่อก่อให้เกิดกิจกรรมทางการเงิน, การลงทุน, การซื้อขาย, ข้อเสนอแนะ หรือคำแนะนำประเภทอื่น ๆ ที่ให้หรือรับรองโดย TradingView อ่านเพิ่มเติมใน ข้อกำหนดการใช้งาน