Chevron ( CVX) Daily: Testing Key Support – Mapping Risk Profiles Near 200 EMA For Mean-Reversion Long
### 🛢️ Chevron Corporation (CVX) Daily Technical Study (Ref: CVX_2026-06-17_11-53-39.png)
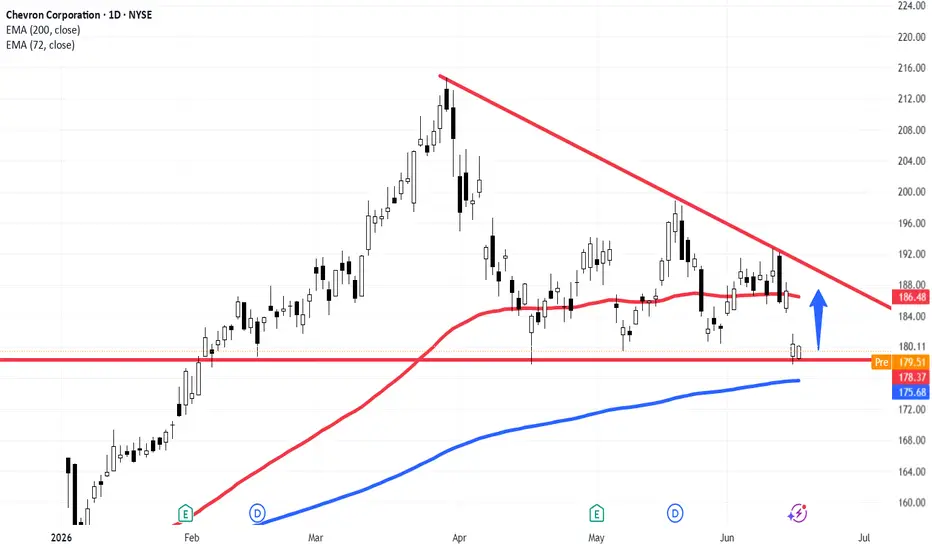
We are analyzing Chevron Corporation (CVX - NYSE) on the Daily (1D) timeframe, where price action is currently intersecting a critical structural value zone.
The stock concluded its last formal session printing at **180.11 (-0.16%)**, with immediate pre-market indicators registering at **179.30**. The price is reacting directly on top of a significant multi-month horizontal support baseline.
---
### 🔍 Technical Geometry & Market Context:
1. **The Horizontal Demand Floor:** Price is testing the immediate horizontal support level marked at **178.37** (red horizontal line).
2. **The 200 EMA Threat/Magnet:** As a professional analyst, one must account for near-term volatility. There is an active risk that price action may sweep liquidity slightly lower to test the long-term institutional trend filter—the **200-period EMA (blue line at 175.68)**—before fully initiating a sustained bounce.
3. **The Upside Destination:** The primary macro target for this technical mean-reversion move is the dominant **Descending Trendline (LTB - upper diagonal red line)**, which heavily converges just above the current position of the **72-period EMA (red line at 186.48)**.
---
### 🛡️ Operational Execution & Risk Architecture:
We have established two distinct defensive frameworks depending on your capital-risk tolerances:
* **Option A: The Institutional Conservative Blueprint (Prudent)**
Place the protective Stop Loss securely **below the 200-period EMA (below 175.68)**. This approach grants the market sufficient breathing room to absorb a potential secondary liquidity sweep without prematurely invalidating the bullish thesis.
* **Option B: The Aggressive Intraday Blueprint (Higher Risk)**
Place a tighter protective Stop Loss immediately below the horizontal support line of **178.37**. While this maximizes the structural Risk/Reward ratio, it leaves the position highly vulnerable to local stop-hunting spikes before a reversal occurs.
### 🎯 Systematic Position Management:
* **Milestone 1 (1:1 Risk/Reward):** Upon price achieving our initial **1RR** upside extension, a partial profit management trigger is activated. The remaining protective Stop Loss is systematically trailed to the **original entry point (Break-Even/ZERO risk)**.
* **Milestone 2 (2:1 Risk/Reward):** With all downside exposure eliminated, the runner position is managed to target the structural deceleration zone near the overhead LTB for a full **2RR** cycle completion.
---
📊 **ChartPro Data**
*Systematic Energy Sector Research, Position Architecture & Mathematical Risk Management.*
⚠️ **Disclaimer:** For educational and informational purposes only. This active chart study represents a personal trading framework and does not constitute financial or investment advice.
CVX) Daily: Testing Key Support – Mapping Risk Profiles Near 200 EMA For Mean-Reversion Long### 🛢️ Chevron Corporation (
CVX) Daily Technical Study (Ref: CVX_2026-06-17_11-53-39.png)We are analyzing Chevron Corporation (
CVX - NYSE) on the Daily (1D) timeframe, where price action is currently intersecting a critical structural value zone. The stock concluded its last formal session printing at **180.11 (-0.16%)**, with immediate pre-market indicators registering at **179.30**. The price is reacting directly on top of a significant multi-month horizontal support baseline.
---
### 🔍 Technical Geometry & Market Context:
1. **The Horizontal Demand Floor:** Price is testing the immediate horizontal support level marked at **178.37** (red horizontal line).
2. **The 200 EMA Threat/Magnet:** As a professional analyst, one must account for near-term volatility. There is an active risk that price action may sweep liquidity slightly lower to test the long-term institutional trend filter—the **200-period EMA (blue line at 175.68)**—before fully initiating a sustained bounce.
3. **The Upside Destination:** The primary macro target for this technical mean-reversion move is the dominant **Descending Trendline (LTB - upper diagonal red line)**, which heavily converges just above the current position of the **72-period EMA (red line at 186.48)**.
---
### 🛡️ Operational Execution & Risk Architecture:
We have established two distinct defensive frameworks depending on your capital-risk tolerances:
* **Option A: The Institutional Conservative Blueprint (Prudent)**
Place the protective Stop Loss securely **below the 200-period EMA (below 175.68)**. This approach grants the market sufficient breathing room to absorb a potential secondary liquidity sweep without prematurely invalidating the bullish thesis.
* **Option B: The Aggressive Intraday Blueprint (Higher Risk)**
Place a tighter protective Stop Loss immediately below the horizontal support line of **178.37**. While this maximizes the structural Risk/Reward ratio, it leaves the position highly vulnerable to local stop-hunting spikes before a reversal occurs.
### 🎯 Systematic Position Management:
* **Milestone 1 (1:1 Risk/Reward):** Upon price achieving our initial **1RR** upside extension, a partial profit management trigger is activated. The remaining protective Stop Loss is systematically trailed to the **original entry point (Break-Even/ZERO risk)**.
* **Milestone 2 (2:1 Risk/Reward):** With all downside exposure eliminated, the runner position is managed to target the structural deceleration zone near the overhead LTB for a full **2RR** cycle completion.
---
📊 **ChartPro Data**
*Systematic Energy Sector Research, Position Architecture & Mathematical Risk Management.*
⚠️ **Disclaimer:** For educational and informational purposes only. This active chart study represents a personal trading framework and does not constitute financial or investment advice.

คำจำกัดสิทธิ์ความรับผิดชอบ
ข้อมูลและบทความไม่ได้มีวัตถุประสงค์เพื่อก่อให้เกิดกิจกรรมทางการเงิน, การลงทุน, การซื้อขาย, ข้อเสนอแนะ หรือคำแนะนำประเภทอื่น ๆ ที่ให้หรือรับรองโดย TradingView อ่านเพิ่มเติมใน ข้อกำหนดการใช้งาน
คำจำกัดสิทธิ์ความรับผิดชอบ
ข้อมูลและบทความไม่ได้มีวัตถุประสงค์เพื่อก่อให้เกิดกิจกรรมทางการเงิน, การลงทุน, การซื้อขาย, ข้อเสนอแนะ หรือคำแนะนำประเภทอื่น ๆ ที่ให้หรือรับรองโดย TradingView อ่านเพิ่มเติมใน ข้อกำหนดการใช้งาน