
Good morning, TradingView friends!
I’m excited to share my latest market forecast with you. This setup uses Fibonacci and psychological levels as our key indicators.
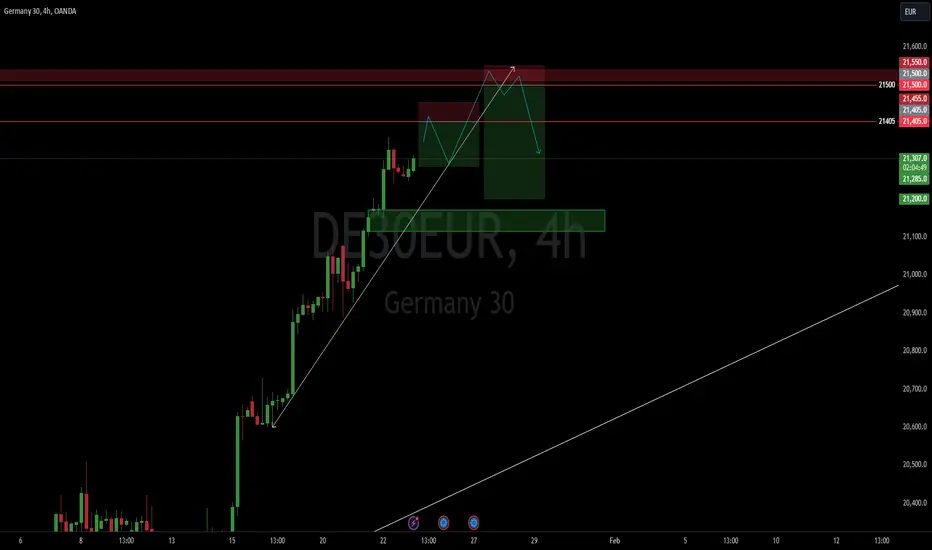
First up, we’re looking at the 21,405 level. It's an important Fibonacci point, and I believe the price will bounce back here, heading towards the trend line. Next, I expect the ascending trend line to hold strong, guiding the price to a crucial psychological and Fibonacci level at 21,500. From there, we might see a 4-hour and daily correction.
For confirming these moves, keep an eye on the lower time frames. A good sign to watch for is an M-pattern with a Lower High on the second leg.
Can't wait to hear your thoughts and keep the conversation going!
I’m excited to share my latest market forecast with you. This setup uses Fibonacci and psychological levels as our key indicators.
First up, we’re looking at the 21,405 level. It's an important Fibonacci point, and I believe the price will bounce back here, heading towards the trend line. Next, I expect the ascending trend line to hold strong, guiding the price to a crucial psychological and Fibonacci level at 21,500. From there, we might see a 4-hour and daily correction.
For confirming these moves, keep an eye on the lower time frames. A good sign to watch for is an M-pattern with a Lower High on the second leg.
Can't wait to hear your thoughts and keep the conversation going!
บันทึก
Check my Oil charts to see confirmation example.บันทึก
Check my oil charts for a confirmation example.บันทึก
Dax just broke the level with no signs of pause, I'll look for 21500 level, you can ignore the first selling levelการซื้อขายยังคงดำเนินอยู่
Dax reached the 21500 sell level and we have a M pattern in 30M, today we have Red folder news for Germany, I'll take a small lots on this setup, or you can wait for another M pattern in 1H.บันทึก
Dax is running 50+ pips on the sell, you can secure some here and move SL to BE if you'd likeบันทึก
Dax reached 100 pips profit, you should secure at least 1/3 of the position and let it run if you want, also for the previous selling level (that is not recommended) it is better to wait for the yellow arrow.
บันทึก
Dax almost Hit the TP for Both Trade Ideas, you can close 90% here and leave a runner if you'd like,Please support me to send more tradesปิดการเทรด: ถึงเป้าหมายการทำกำไร
Congrats if you took this sell, stay tuned for the next trade ideas
การนำเสนอที่เกี่ยวข้อง
คำจำกัดสิทธิ์ความรับผิดชอบ
ข้อมูลและบทความไม่ได้มีวัตถุประสงค์เพื่อก่อให้เกิดกิจกรรมทางการเงิน, การลงทุน, การซื้อขาย, ข้อเสนอแนะ หรือคำแนะนำประเภทอื่น ๆ ที่ให้หรือรับรองโดย TradingView อ่านเพิ่มเติมใน ข้อกำหนดการใช้งาน
การนำเสนอที่เกี่ยวข้อง
คำจำกัดสิทธิ์ความรับผิดชอบ
ข้อมูลและบทความไม่ได้มีวัตถุประสงค์เพื่อก่อให้เกิดกิจกรรมทางการเงิน, การลงทุน, การซื้อขาย, ข้อเสนอแนะ หรือคำแนะนำประเภทอื่น ๆ ที่ให้หรือรับรองโดย TradingView อ่านเพิ่มเติมใน ข้อกำหนดการใช้งาน