
Technical Context
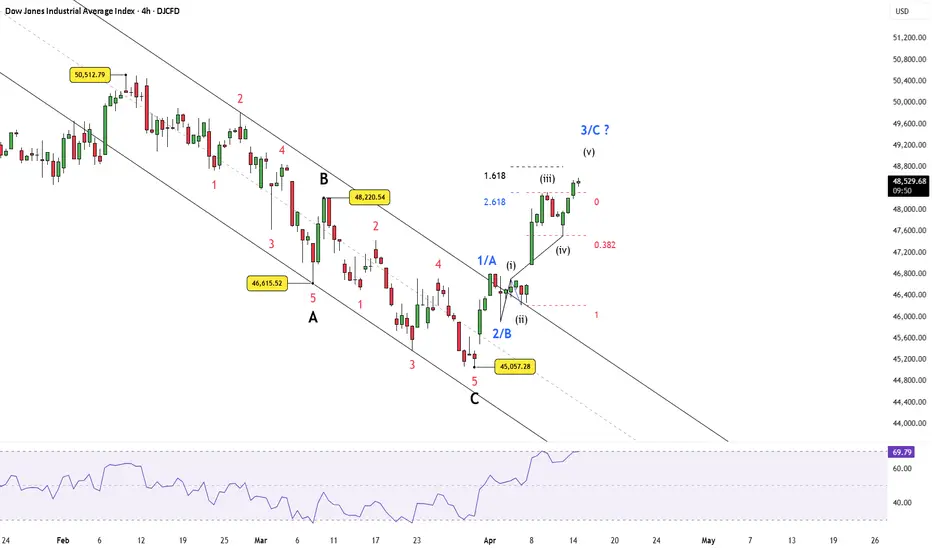
Analyzing the Dow Jones Industrial Average Index on the 4-hour timeframe, price action has established a definitive breakout from a descending parallel channel that originated at the 50,512.79 macro high. The prior downtrend is mapped as an A-B-C zigzag correction. This is characterized by a red 1-2-3-4-5 internal motive subdivision terminating Wave A at 46,615.52, a corrective bounce to Wave B at 48,220.54, and a final red 1-2-3-4-5 sequence driving price into the Wave C low at 45,057.28 as an ending diagnol.
The subsequent bullish breakout from the 45,057.28 origin point displays a clear five-wave internal micro-structure labeled as (i), (ii), (iii), (iv), and (v). This advance is actively testing the 1.618 Fibonacci extension. The dual blue annotations of 1/A, 2/B, and 3/C accurately reflect the current structural ambiguity: this leg is either Wave 3 of a new primary impulse or Wave C of a complex upward correction. RSI exhaustion above the 70 level coincides with the 1.618 Fibonacci resistance, indicating an imminent structural pullback.
Bullish Scenario
Bearish Scenario
Summary
The chart presents a inflection point for the index. While the breakout from the A-B-C channel strongly favors the bullish 1-2-3 impulse thesis, the confluence of the (v) micro-wave completion, the 1.618 Fibonacci extension, and an overbought RSI demands defensive posturing. Await the impending retracement to confirm whether the structure yields a valid Wave 4 support or fails into a broader corrective pattern.
Disclaimer: This analysis is for educational purposes only and does not constitute investment advice. Please make your own decisions before making any trading decisions.
Analyzing the Dow Jones Industrial Average Index on the 4-hour timeframe, price action has established a definitive breakout from a descending parallel channel that originated at the 50,512.79 macro high. The prior downtrend is mapped as an A-B-C zigzag correction. This is characterized by a red 1-2-3-4-5 internal motive subdivision terminating Wave A at 46,615.52, a corrective bounce to Wave B at 48,220.54, and a final red 1-2-3-4-5 sequence driving price into the Wave C low at 45,057.28 as an ending diagnol.
The subsequent bullish breakout from the 45,057.28 origin point displays a clear five-wave internal micro-structure labeled as (i), (ii), (iii), (iv), and (v). This advance is actively testing the 1.618 Fibonacci extension. The dual blue annotations of 1/A, 2/B, and 3/C accurately reflect the current structural ambiguity: this leg is either Wave 3 of a new primary impulse or Wave C of a complex upward correction. RSI exhaustion above the 70 level coincides with the 1.618 Fibonacci resistance, indicating an imminent structural pullback.
Bullish Scenario
- Thesis: The macro A-B-C correction concluded at 45,057.28. The blue 1-2-3 labels take precedence, identifying the current sequence as a developing primary impulse.
- Trigger: A measured retracement (Wave 4) that tests and holds support above the red Fibonacci 0.382 or 0 levels, followed by a confirmed bullish pivot.
- Targets: An advance toward the 2.618 blue Fibonacci extension, followed by a retest of the Wave B structural resistance at 48,220.54 and the macro high at 50,512.79.
- Invalidation (Stop Loss): A retracement that breaches the red Fibonacci 1 level or falls back below the origin of the 1/A wave, invalidating the impulsive structure.
Bearish Scenario
- Thesis: The primary trend remains bearish. The current rally is a corrective sequence mapped by the blue A-B-C labels, exhausting at the current 1.618 extension.
- Trigger: Immediate price rejection at the 1.618 Fibonacci level, followed by a high-volume breakdown through the (iv) micro-wave support.
- Targets: A retest of the channel's upper boundary (dynamic support) and a full retracement back to the Wave C absolute low at 45,057.28.
- Invalidation (Stop Loss): Sustained volume driving price cleanly through the 1.618 Fibonacci level toward the 2.618 extension.
Summary
The chart presents a inflection point for the index. While the breakout from the A-B-C channel strongly favors the bullish 1-2-3 impulse thesis, the confluence of the (v) micro-wave completion, the 1.618 Fibonacci extension, and an overbought RSI demands defensive posturing. Await the impending retracement to confirm whether the structure yields a valid Wave 4 support or fails into a broader corrective pattern.
Disclaimer: This analysis is for educational purposes only and does not constitute investment advice. Please make your own decisions before making any trading decisions.

WaveXplorer | Elliott Wave insights
📊 X profile: @veerappa89
📊 X profile: @veerappa89
การนำเสนอที่เกี่ยวข้อง
คำจำกัดสิทธิ์ความรับผิดชอบ
ข้อมูลและบทความไม่ได้มีวัตถุประสงค์เพื่อก่อให้เกิดกิจกรรมทางการเงิน, การลงทุน, การซื้อขาย, ข้อเสนอแนะ หรือคำแนะนำประเภทอื่น ๆ ที่ให้หรือรับรองโดย TradingView อ่านเพิ่มเติมใน ข้อกำหนดการใช้งาน
WaveXplorer | Elliott Wave insights
📊 X profile: @veerappa89
📊 X profile: @veerappa89
การนำเสนอที่เกี่ยวข้อง
คำจำกัดสิทธิ์ความรับผิดชอบ
ข้อมูลและบทความไม่ได้มีวัตถุประสงค์เพื่อก่อให้เกิดกิจกรรมทางการเงิน, การลงทุน, การซื้อขาย, ข้อเสนอแนะ หรือคำแนะนำประเภทอื่น ๆ ที่ให้หรือรับรองโดย TradingView อ่านเพิ่มเติมใน ข้อกำหนดการใช้งาน