
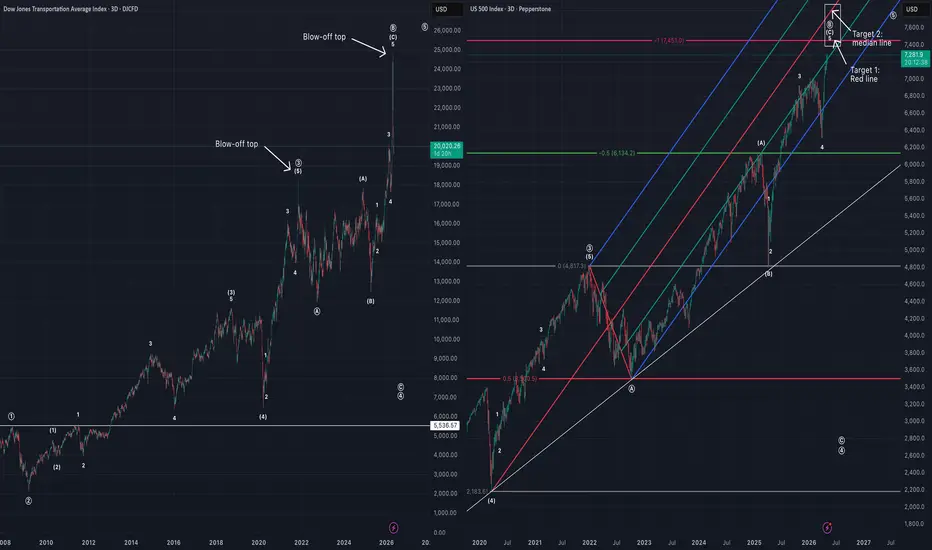
Chart comparing DJT and US500.
This comparison assumes both are in similar positions regarding their supercycle structures.
DJT has already completed its ((B)) wave with a blow-off top, as DJT tends to be a leading rather than lagging indicator for the larger equity markets.
US500 has been very technical since COVID low. I'm looking for it to top around 7451 or perhaps it goes a little bit extra to the median line target.
This comparison assumes both are in similar positions regarding their supercycle structures.
DJT has already completed its ((B)) wave with a blow-off top, as DJT tends to be a leading rather than lagging indicator for the larger equity markets.
US500 has been very technical since COVID low. I'm looking for it to top around 7451 or perhaps it goes a little bit extra to the median line target.

คำจำกัดสิทธิ์ความรับผิดชอบ
ข้อมูลและบทความไม่ได้มีวัตถุประสงค์เพื่อก่อให้เกิดกิจกรรมทางการเงิน, การลงทุน, การซื้อขาย, ข้อเสนอแนะ หรือคำแนะนำประเภทอื่น ๆ ที่ให้หรือรับรองโดย TradingView อ่านเพิ่มเติมใน ข้อกำหนดการใช้งาน
คำจำกัดสิทธิ์ความรับผิดชอบ
ข้อมูลและบทความไม่ได้มีวัตถุประสงค์เพื่อก่อให้เกิดกิจกรรมทางการเงิน, การลงทุน, การซื้อขาย, ข้อเสนอแนะ หรือคำแนะนำประเภทอื่น ๆ ที่ให้หรือรับรองโดย TradingView อ่านเพิ่มเติมใน ข้อกำหนดการใช้งาน