
30-11
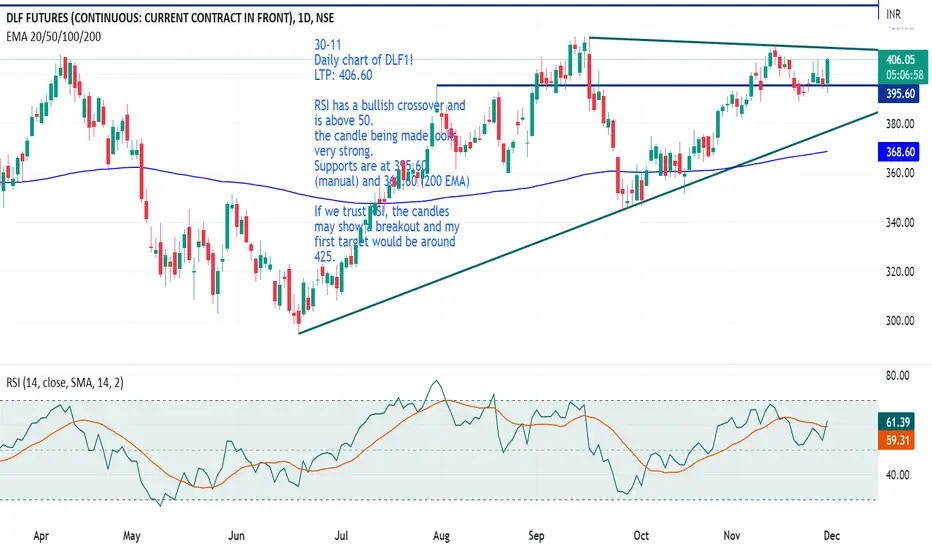
Daily chart of DLF1!
LTP: 406.60
RSI has a bullish crossover and is above 50.
the candle being made looks very strong.
Supports are at 395.60 (manual) and 368.60 (200 EMA)
If we trust RSI, the candles may show a breakout and my first target would be around 425.
Daily chart of DLF1!
LTP: 406.60
RSI has a bullish crossover and is above 50.
the candle being made looks very strong.
Supports are at 395.60 (manual) and 368.60 (200 EMA)
If we trust RSI, the candles may show a breakout and my first target would be around 425.

คำจำกัดสิทธิ์ความรับผิดชอบ
ข้อมูลและบทความไม่ได้มีวัตถุประสงค์เพื่อก่อให้เกิดกิจกรรมทางการเงิน, การลงทุน, การซื้อขาย, ข้อเสนอแนะ หรือคำแนะนำประเภทอื่น ๆ ที่ให้หรือรับรองโดย TradingView อ่านเพิ่มเติมใน ข้อกำหนดการใช้งาน
คำจำกัดสิทธิ์ความรับผิดชอบ
ข้อมูลและบทความไม่ได้มีวัตถุประสงค์เพื่อก่อให้เกิดกิจกรรมทางการเงิน, การลงทุน, การซื้อขาย, ข้อเสนอแนะ หรือคำแนะนำประเภทอื่น ๆ ที่ให้หรือรับรองโดย TradingView อ่านเพิ่มเติมใน ข้อกำหนดการใช้งาน