
💹 Avenue Supermarts Ltd (NSE: DMART)
Sector: Retail | CMP: 3841.6
View: Reaction from Higher-Timeframe Demand | Early Momentum Recovery
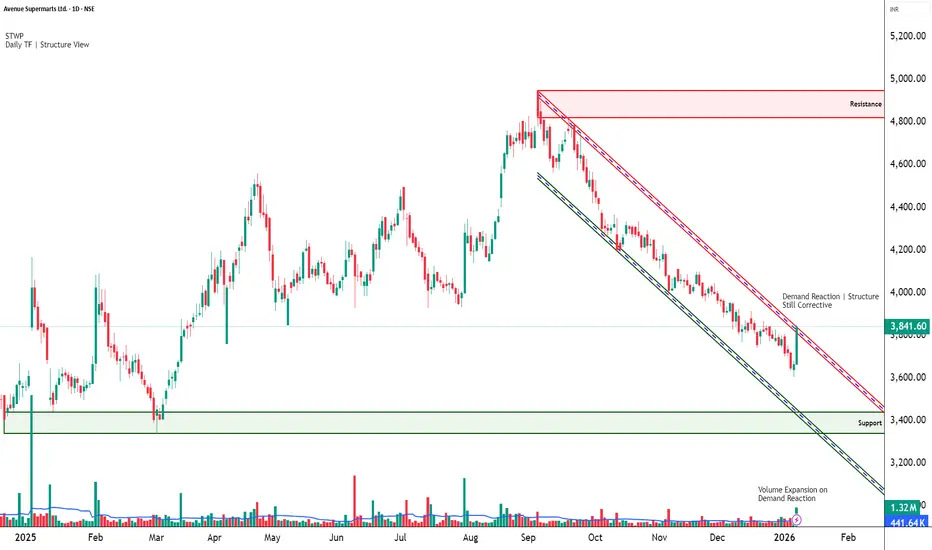
Chart Pattern: Descending Channel (Corrective)
Candlestick Pattern: Strong Bullish Marubozu
________________________________________
Price Action
DMART has spent the last few months in a controlled corrective decline after a prior uptrend, respecting a well-defined descending channel marked by lower highs. Price recently reacted sharply from a higher-timeframe demand base in the 3600 region, printing a decisive bullish expansion candle and closing near the session high. This move signals a shift from passive correction to active demand emergence, with sellers losing near-term control at lower levels. While the broader structure is still recovering and overhead resistance remains intact, the latest price behaviour reflects an early change in character rather than a weak bounce.
________________________________________
Technical Analysis (Chart Readings)
Technically, the chart shows improving alignment after prolonged consolidation. The bullish Marubozu indicates strong buyer dominance with minimal intraday supply. This expansion follows a compression phase, suggesting a short-term volatility release. Momentum indicators remain constructive but not euphoric — RSI around 51 reflects healthy recovery without exhaustion, while price reclaiming short-term averages points to stabilisation above demand. Volume participation is meaningfully above recent averages, confirming that the move is supported by participation rather than thin liquidity. Overall, the technical setup reflects a recovery phase with improving momentum but still within a broader corrective framework.
________________________________________
Key Levels (Chart Readings)
On the downside, a strong structural support zone lies in the 3600–3500 region, which has repeatedly absorbed selling pressure and now acts as the primary downside reference. Intermediate supports around 3719 and 3596 provide near-term cushions during pullbacks. On the upside, immediate resistance is visible near 3907–3972, followed by stronger overhead supply near 4095 and above, where prior distribution has occurred. Price is currently positioned between demand and resistance, making acceptance above these levels critical for sustained upside continuation.
________________________________________
Demand & Supply Zones (Chart Readings)
The demand–supply framework offers clear structure across timeframes. On the Daily timeframe, a major demand zone is established between 3680–3605, forming the broader base for the current recovery attempt, while a higher-timeframe supply zone remains active near 4111–4222. On the Swing timeframe, demand is concentrated around 3680–3605, with swing supply visible near 4173–4222. Intraday demand zones are clustered near 3769–3747 and 3743–3720, highlighting immediate buying interest, while short-term supply remains active near 3668–3658 on pullbacks. These zones frame the current recovery phase, with price rotating upward from demand into nearby supply.
________________________________________
STWP Trade Analysis
DMART has initiated a momentum recovery from a higher-timeframe demand base, supported by rising volume and improving price stability. From an intraday perspective, holding above the 3800–3850 zone keeps the bullish bias intact and allows scope for continuation toward upper resistance levels if participation sustains. From a short-term swing (hybrid) standpoint, the same structure supports a broader mean-expansion framework over the next few sessions, provided price does not slip back into the prior demand range. While the trend bias is turning upward, the presence of overhead supply and elevated volatility warrants disciplined execution, controlled position sizing, and strict respect for structural invalidation levels.
________________________________________
Final Outlook
Momentum: Strong
Trend: Up
Risk: High
Volume: High
The structure favours further recovery as long as price sustains above demand zones, but confirmation through acceptance above overhead supply is essential for trend acceleration. This phase rewards structure awareness, patience, and risk discipline over prediction.
Sector: Retail | CMP: 3841.6
View: Reaction from Higher-Timeframe Demand | Early Momentum Recovery
Chart Pattern: Descending Channel (Corrective)
Candlestick Pattern: Strong Bullish Marubozu
________________________________________
Price Action
DMART has spent the last few months in a controlled corrective decline after a prior uptrend, respecting a well-defined descending channel marked by lower highs. Price recently reacted sharply from a higher-timeframe demand base in the 3600 region, printing a decisive bullish expansion candle and closing near the session high. This move signals a shift from passive correction to active demand emergence, with sellers losing near-term control at lower levels. While the broader structure is still recovering and overhead resistance remains intact, the latest price behaviour reflects an early change in character rather than a weak bounce.
________________________________________
Technical Analysis (Chart Readings)
Technically, the chart shows improving alignment after prolonged consolidation. The bullish Marubozu indicates strong buyer dominance with minimal intraday supply. This expansion follows a compression phase, suggesting a short-term volatility release. Momentum indicators remain constructive but not euphoric — RSI around 51 reflects healthy recovery without exhaustion, while price reclaiming short-term averages points to stabilisation above demand. Volume participation is meaningfully above recent averages, confirming that the move is supported by participation rather than thin liquidity. Overall, the technical setup reflects a recovery phase with improving momentum but still within a broader corrective framework.
________________________________________
Key Levels (Chart Readings)
On the downside, a strong structural support zone lies in the 3600–3500 region, which has repeatedly absorbed selling pressure and now acts as the primary downside reference. Intermediate supports around 3719 and 3596 provide near-term cushions during pullbacks. On the upside, immediate resistance is visible near 3907–3972, followed by stronger overhead supply near 4095 and above, where prior distribution has occurred. Price is currently positioned between demand and resistance, making acceptance above these levels critical for sustained upside continuation.
________________________________________
Demand & Supply Zones (Chart Readings)
The demand–supply framework offers clear structure across timeframes. On the Daily timeframe, a major demand zone is established between 3680–3605, forming the broader base for the current recovery attempt, while a higher-timeframe supply zone remains active near 4111–4222. On the Swing timeframe, demand is concentrated around 3680–3605, with swing supply visible near 4173–4222. Intraday demand zones are clustered near 3769–3747 and 3743–3720, highlighting immediate buying interest, while short-term supply remains active near 3668–3658 on pullbacks. These zones frame the current recovery phase, with price rotating upward from demand into nearby supply.
________________________________________
STWP Trade Analysis
DMART has initiated a momentum recovery from a higher-timeframe demand base, supported by rising volume and improving price stability. From an intraday perspective, holding above the 3800–3850 zone keeps the bullish bias intact and allows scope for continuation toward upper resistance levels if participation sustains. From a short-term swing (hybrid) standpoint, the same structure supports a broader mean-expansion framework over the next few sessions, provided price does not slip back into the prior demand range. While the trend bias is turning upward, the presence of overhead supply and elevated volatility warrants disciplined execution, controlled position sizing, and strict respect for structural invalidation levels.
________________________________________
Final Outlook
Momentum: Strong
Trend: Up
Risk: High
Volume: High
The structure favours further recovery as long as price sustains above demand zones, but confirmation through acceptance above overhead supply is essential for trend acceleration. This phase rewards structure awareness, patience, and risk discipline over prediction.

STWP | Mentor & Demand-Supply Specialist |
Empowering traders through structured learning |
simpletradewithpatience.com
Community: chat.whatsapp.com/BEYz0tkqP0fJPBCWf59uel
wa.me/message/6IOPHGOXMGZ4N1
Educational Only
Empowering traders through structured learning |
simpletradewithpatience.com
Community: chat.whatsapp.com/BEYz0tkqP0fJPBCWf59uel
wa.me/message/6IOPHGOXMGZ4N1
Educational Only
คำจำกัดสิทธิ์ความรับผิดชอบ
ข้อมูลและบทความไม่ได้มีวัตถุประสงค์เพื่อก่อให้เกิดกิจกรรมทางการเงิน, การลงทุน, การซื้อขาย, ข้อเสนอแนะ หรือคำแนะนำประเภทอื่น ๆ ที่ให้หรือรับรองโดย TradingView อ่านเพิ่มเติมใน ข้อกำหนดการใช้งาน
STWP | Mentor & Demand-Supply Specialist |
Empowering traders through structured learning |
simpletradewithpatience.com
Community: chat.whatsapp.com/BEYz0tkqP0fJPBCWf59uel
wa.me/message/6IOPHGOXMGZ4N1
Educational Only
Empowering traders through structured learning |
simpletradewithpatience.com
Community: chat.whatsapp.com/BEYz0tkqP0fJPBCWf59uel
wa.me/message/6IOPHGOXMGZ4N1
Educational Only
คำจำกัดสิทธิ์ความรับผิดชอบ
ข้อมูลและบทความไม่ได้มีวัตถุประสงค์เพื่อก่อให้เกิดกิจกรรมทางการเงิน, การลงทุน, การซื้อขาย, ข้อเสนอแนะ หรือคำแนะนำประเภทอื่น ๆ ที่ให้หรือรับรองโดย TradingView อ่านเพิ่มเติมใน ข้อกำหนดการใช้งาน