
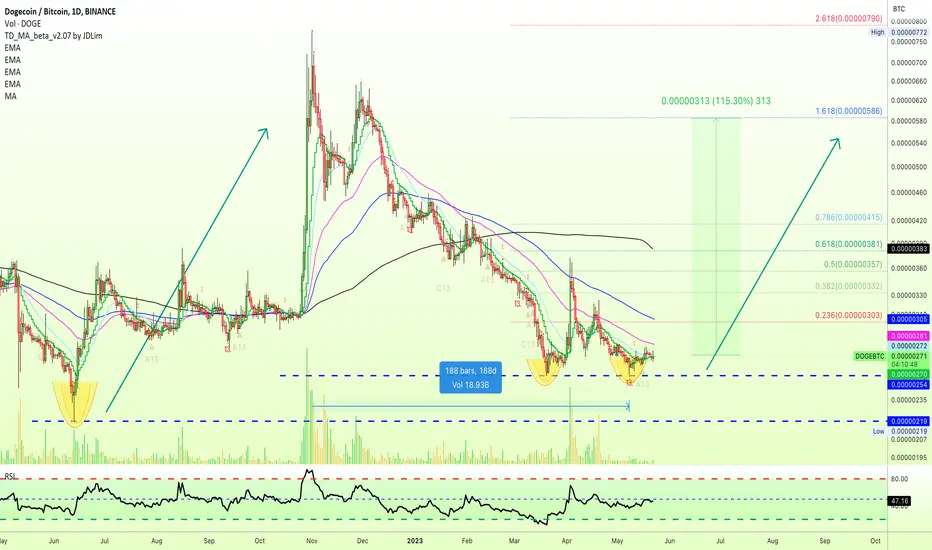
We read charts and based on what the charts are saying we extract trade signals.
Chart reading is not about being right or wrong, it is about spotting opportunities that are skewed in our favor.
For example, a trade setup with low risk and high potential for reward.
The market conditions can always change...
But if there is a drop, the risk is limited, in this case to around 10%. (Anybody can define their own risk, can be 5% just as it can be 20-30%)
If the bulls win and the pair goes up, the potential to win is many times higher than the initial risk we take on.
✔️ We have a double bottom, March vs May.
✔️ We have a long-term higher low, June 2022 vs the current double bottom.
✔️ Another signal is the curve that just showed up on the MA200 indicator.
When this indicator points down coming from the upside, prices tend to move towards it.
These are three signals.
✔️ Short-term DOGEBTC is trading above EMA10 today.
✔️ The RSI is good based on the fact that prices are trading near support.
✔️ The last signal is the long duration of the correction, since November 2022 that's a long 6+ months.
Corrections in this type of chart setup can go from 6-8 months.
We are at 7 months almost... Patience is key, the market takes care of the rest.
You can find additional details on the chart.
A star is who you are.
Namaste.
Chart reading is not about being right or wrong, it is about spotting opportunities that are skewed in our favor.
For example, a trade setup with low risk and high potential for reward.
The market conditions can always change...
But if there is a drop, the risk is limited, in this case to around 10%. (Anybody can define their own risk, can be 5% just as it can be 20-30%)
If the bulls win and the pair goes up, the potential to win is many times higher than the initial risk we take on.
✔️ We have a double bottom, March vs May.
✔️ We have a long-term higher low, June 2022 vs the current double bottom.
✔️ Another signal is the curve that just showed up on the MA200 indicator.
When this indicator points down coming from the upside, prices tend to move towards it.
These are three signals.
✔️ Short-term DOGEBTC is trading above EMA10 today.
✔️ The RSI is good based on the fact that prices are trading near support.
✔️ The last signal is the long duration of the correction, since November 2022 that's a long 6+ months.
Corrections in this type of chart setup can go from 6-8 months.
We are at 7 months almost... Patience is key, the market takes care of the rest.
You can find additional details on the chart.
A star is who you are.
Namaste.

Trading Cryptocurrencies can be the hardest undertaking ever without the right trade-numbers, without accurate private-access information. Free is free, but the best always requires sweat, an investment. Since 2017 👇
t.me/masteranandatrades/8778
t.me/masteranandatrades/8778
การนำเสนอที่เกี่ยวข้อง
คำจำกัดสิทธิ์ความรับผิดชอบ
ข้อมูลและบทความไม่ได้มีวัตถุประสงค์เพื่อก่อให้เกิดกิจกรรมทางการเงิน, การลงทุน, การซื้อขาย, ข้อเสนอแนะ หรือคำแนะนำประเภทอื่น ๆ ที่ให้หรือรับรองโดย TradingView อ่านเพิ่มเติมใน ข้อกำหนดการใช้งาน
Trading Cryptocurrencies can be the hardest undertaking ever without the right trade-numbers, without accurate private-access information. Free is free, but the best always requires sweat, an investment. Since 2017 👇
t.me/masteranandatrades/8778
t.me/masteranandatrades/8778
การนำเสนอที่เกี่ยวข้อง
คำจำกัดสิทธิ์ความรับผิดชอบ
ข้อมูลและบทความไม่ได้มีวัตถุประสงค์เพื่อก่อให้เกิดกิจกรรมทางการเงิน, การลงทุน, การซื้อขาย, ข้อเสนอแนะ หรือคำแนะนำประเภทอื่น ๆ ที่ให้หรือรับรองโดย TradingView อ่านเพิ่มเติมใน ข้อกำหนดการใช้งาน