
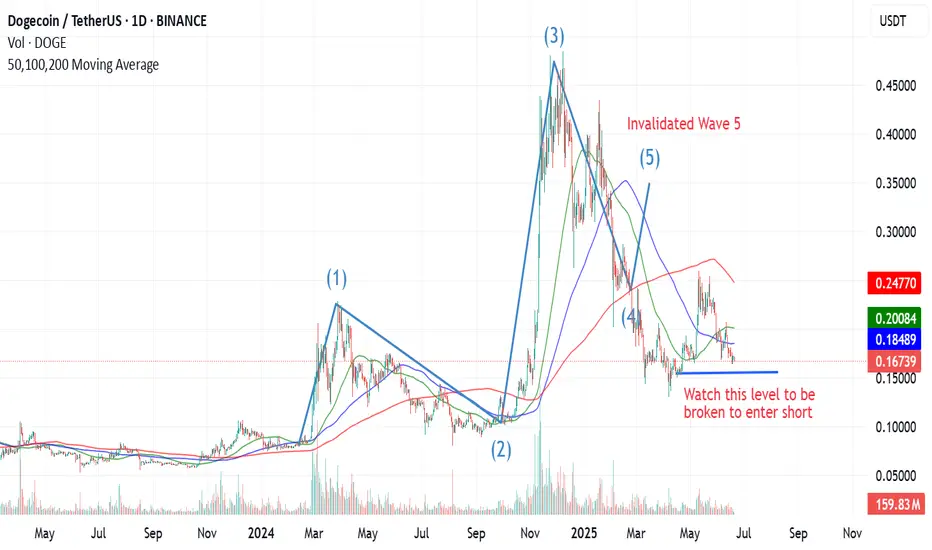
Lets analyse Doge on 1D timeframe since Feb 2024.
Wave 1 - It reached a high of 0.23 from a bottom price range of 0.084.
Wave 2 - Corrective wave take the prices back to 0.08 in Aug - Sep 24.
Wave 3 - As per theory should be the strongest and it proved to be one, taking the price to 4 year high of 0.4843.
Till now everything was fine and the next corrective Wave 4 started which as per classical Elliott Wave theory, should never enter the price territory of Wave 1.
Wave 1 high was 0.2288 however if we see the current price 0.168 (Wave 4), it already has invalidated the previous wave.
So now if we re-evaluate -
The run from 0.084 to 0.4843 was a Zigzag A-B-C Pattern with A marking as 0.2288, B as 0.08 and C = 0.4843. So seems we are in a complex correction phase and can see prices move down to previous lows or even lower.
So for now be patient and watch the prices between $0.168–0.182, if it reclaims $0.228–0.245, then we can consider entering a Long.
A breakdown below 0.154 can cause a lot of trouble for Bulls.
Trade Safely!
Thanks!
Wave 1 - It reached a high of 0.23 from a bottom price range of 0.084.
Wave 2 - Corrective wave take the prices back to 0.08 in Aug - Sep 24.
Wave 3 - As per theory should be the strongest and it proved to be one, taking the price to 4 year high of 0.4843.
Till now everything was fine and the next corrective Wave 4 started which as per classical Elliott Wave theory, should never enter the price territory of Wave 1.
Wave 1 high was 0.2288 however if we see the current price 0.168 (Wave 4), it already has invalidated the previous wave.
So now if we re-evaluate -
The run from 0.084 to 0.4843 was a Zigzag A-B-C Pattern with A marking as 0.2288, B as 0.08 and C = 0.4843. So seems we are in a complex correction phase and can see prices move down to previous lows or even lower.
So for now be patient and watch the prices between $0.168–0.182, if it reclaims $0.228–0.245, then we can consider entering a Long.
A breakdown below 0.154 can cause a lot of trouble for Bulls.
Trade Safely!
Thanks!

คำจำกัดสิทธิ์ความรับผิดชอบ
ข้อมูลและบทความไม่ได้มีวัตถุประสงค์เพื่อก่อให้เกิดกิจกรรมทางการเงิน, การลงทุน, การซื้อขาย, ข้อเสนอแนะ หรือคำแนะนำประเภทอื่น ๆ ที่ให้หรือรับรองโดย TradingView อ่านเพิ่มเติมใน ข้อกำหนดการใช้งาน
คำจำกัดสิทธิ์ความรับผิดชอบ
ข้อมูลและบทความไม่ได้มีวัตถุประสงค์เพื่อก่อให้เกิดกิจกรรมทางการเงิน, การลงทุน, การซื้อขาย, ข้อเสนอแนะ หรือคำแนะนำประเภทอื่น ๆ ที่ให้หรือรับรองโดย TradingView อ่านเพิ่มเติมใน ข้อกำหนดการใช้งาน