
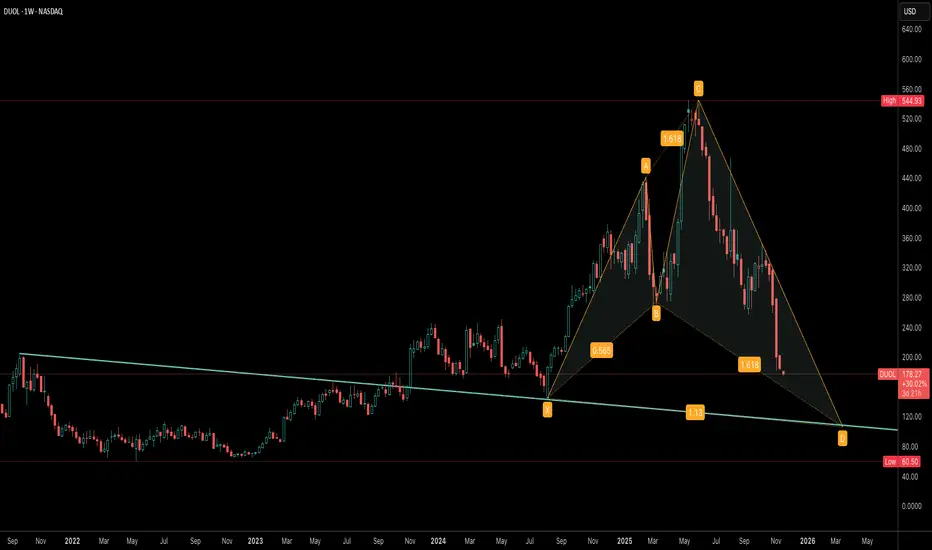
DUOL is currently forming a Bearish Shark Harmonic on the weekly timeframe, with price progressing toward the potential D-point completion zone.
The structure follows the classic Shark ratios, with the 0.886–1.13 leg projecting a major support area that aligns with the long-term descending trendline.
Pattern Highlights:
0X → A: Strong impulsive move leading into pattern formation
A → B: Retracement near the 0.5–0.618 zone
B → C: Extended leg hitting the 1.618 region
C → D: Final 1.13 projection targeting long-term structural support
This convergence of harmonic completion + multi-year trendline support makes the D-zone an important region to watch for a potential reaction or reversal.
Momentum remains bearish, but the pattern suggests sellers may be nearing exhaustion as price approaches D.
The structure follows the classic Shark ratios, with the 0.886–1.13 leg projecting a major support area that aligns with the long-term descending trendline.
Pattern Highlights:
0X → A: Strong impulsive move leading into pattern formation
A → B: Retracement near the 0.5–0.618 zone
B → C: Extended leg hitting the 1.618 region
C → D: Final 1.13 projection targeting long-term structural support
This convergence of harmonic completion + multi-year trendline support makes the D-zone an important region to watch for a potential reaction or reversal.
Momentum remains bearish, but the pattern suggests sellers may be nearing exhaustion as price approaches D.

คำจำกัดสิทธิ์ความรับผิดชอบ
ข้อมูลและบทความไม่ได้มีวัตถุประสงค์เพื่อก่อให้เกิดกิจกรรมทางการเงิน, การลงทุน, การซื้อขาย, ข้อเสนอแนะ หรือคำแนะนำประเภทอื่น ๆ ที่ให้หรือรับรองโดย TradingView อ่านเพิ่มเติมใน ข้อกำหนดการใช้งาน
คำจำกัดสิทธิ์ความรับผิดชอบ
ข้อมูลและบทความไม่ได้มีวัตถุประสงค์เพื่อก่อให้เกิดกิจกรรมทางการเงิน, การลงทุน, การซื้อขาย, ข้อเสนอแนะ หรือคำแนะนำประเภทอื่น ๆ ที่ให้หรือรับรองโดย TradingView อ่านเพิ่มเติมใน ข้อกำหนดการใช้งาน