
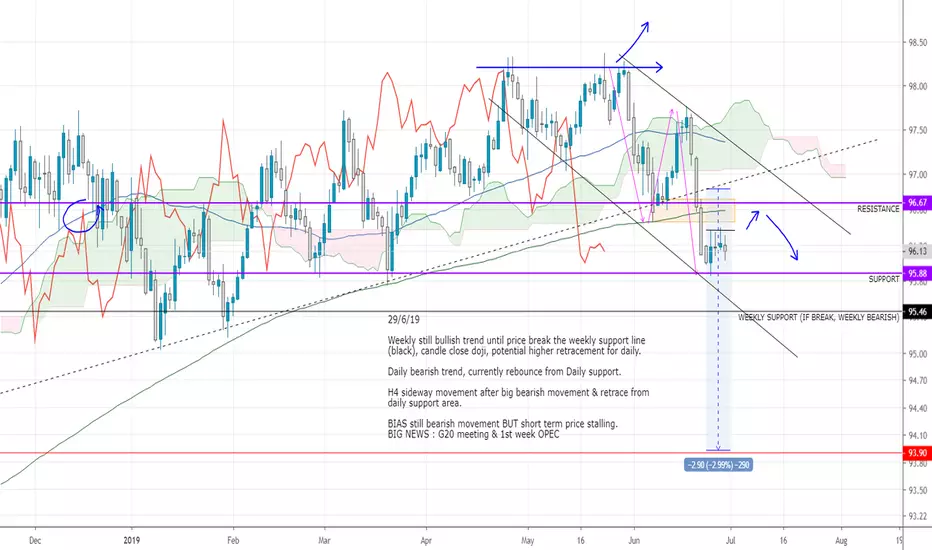
H4 chart

D1 chart

29/6/19
Weekly still bullish trend until price break the weekly support line (black), candle close doji, potential higher retracement for daily.
Daily bearish trend, currently rebounce from Daily support.
H4 sideway movement after big bearish movement & retrace from daily support area.
BIAS still bearish movement BUT short term price stalling.
BIG NEWS : G20 meeting & 1st week OPEC
D1 chart
29/6/19
Weekly still bullish trend until price break the weekly support line (black), candle close doji, potential higher retracement for daily.
Daily bearish trend, currently rebounce from Daily support.
H4 sideway movement after big bearish movement & retrace from daily support area.
BIAS still bearish movement BUT short term price stalling.
BIG NEWS : G20 meeting & 1st week OPEC
บันทึก
USDxxx SELLXxxUSD BUY
Potential USD retrace back UP first b4 continue.
Weekly support area + doji candle closing this week.
Align with some individual pair movement.
As usual, follow your trading plan.
บันทึก
AFTERD1
H4
Price did react at the resistance about 25p but did not make a lower low at H4 showing bullish momentum still strong. Price end up breaking the upper downtrend channel. Daily trend still downtrend until previous high structure ($97.69) broken but at H4 is still bullish.
Short term bullish. Long term trade best when D1 & H4 both trend aligns.

คำจำกัดสิทธิ์ความรับผิดชอบ
ข้อมูลและบทความไม่ได้มีวัตถุประสงค์เพื่อก่อให้เกิดกิจกรรมทางการเงิน, การลงทุน, การซื้อขาย, ข้อเสนอแนะ หรือคำแนะนำประเภทอื่น ๆ ที่ให้หรือรับรองโดย TradingView อ่านเพิ่มเติมใน ข้อกำหนดการใช้งาน
คำจำกัดสิทธิ์ความรับผิดชอบ
ข้อมูลและบทความไม่ได้มีวัตถุประสงค์เพื่อก่อให้เกิดกิจกรรมทางการเงิน, การลงทุน, การซื้อขาย, ข้อเสนอแนะ หรือคำแนะนำประเภทอื่น ๆ ที่ให้หรือรับรองโดย TradingView อ่านเพิ่มเติมใน ข้อกำหนดการใช้งาน