
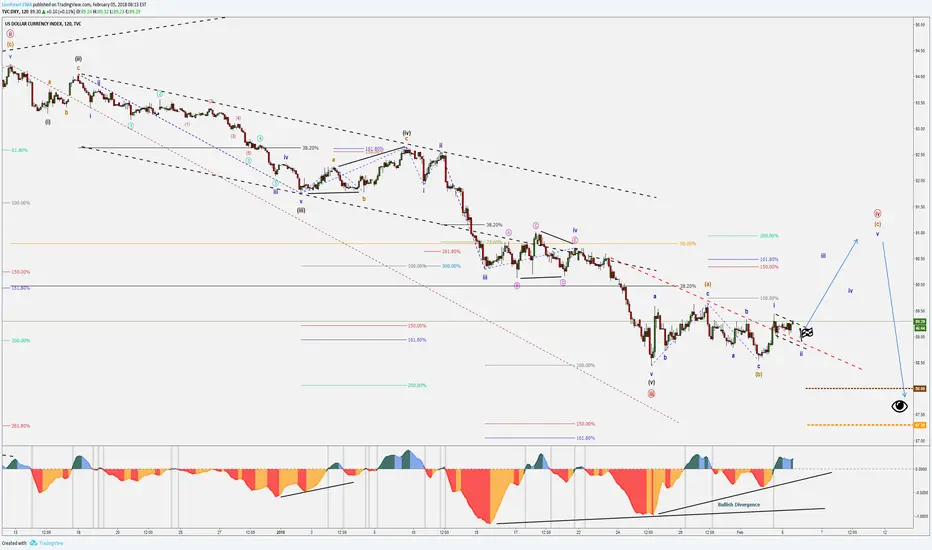
Following up on the previously posted “FED Rate – DXY Technicals – Ready for a Bullish Corrective” video, DXY indeed went towards lower levels, however it did not properly commence the expected Bearish Swing, showing overlaps in its sequence, which could be a sign that the Bullish Corrective is possibly starting this week.
DXY is showing a possible Bullish Divergence, which is present at key Fibonacci Levels, showing a good probability of a Bullish Impulse, caused by a Bullish Divergence and/or the visible Bull Flag.
This Bullish Divergence could signal the end of Minute III (red), which was triggered along with my previous post on Dec 12th “Fed December Rate Hike – DXY Technicals – Elliott Wave Analysis”.
Trades in Focus available for our Members with Entry / SL & TP:
- USD/CHF - BUY
- EUR/USD - SELL
DXY is showing a possible Bullish Divergence, which is present at key Fibonacci Levels, showing a good probability of a Bullish Impulse, caused by a Bullish Divergence and/or the visible Bull Flag.
This Bullish Divergence could signal the end of Minute III (red), which was triggered along with my previous post on Dec 12th “Fed December Rate Hike – DXY Technicals – Elliott Wave Analysis”.
Trades in Focus available for our Members with Entry / SL & TP:
- USD/CHF - BUY
- EUR/USD - SELL
บันทึก
After 4 comes 5.Watch 91 Levels for a Bearish Divergence.
DXY about to fall hard very soon
บันทึก

การนำเสนอที่เกี่ยวข้อง
คำจำกัดสิทธิ์ความรับผิดชอบ
ข้อมูลและบทความไม่ได้มีวัตถุประสงค์เพื่อก่อให้เกิดกิจกรรมทางการเงิน, การลงทุน, การซื้อขาย, ข้อเสนอแนะ หรือคำแนะนำประเภทอื่น ๆ ที่ให้หรือรับรองโดย TradingView อ่านเพิ่มเติมใน ข้อกำหนดการใช้งาน
การนำเสนอที่เกี่ยวข้อง
คำจำกัดสิทธิ์ความรับผิดชอบ
ข้อมูลและบทความไม่ได้มีวัตถุประสงค์เพื่อก่อให้เกิดกิจกรรมทางการเงิน, การลงทุน, การซื้อขาย, ข้อเสนอแนะ หรือคำแนะนำประเภทอื่น ๆ ที่ให้หรือรับรองโดย TradingView อ่านเพิ่มเติมใน ข้อกำหนดการใช้งาน