
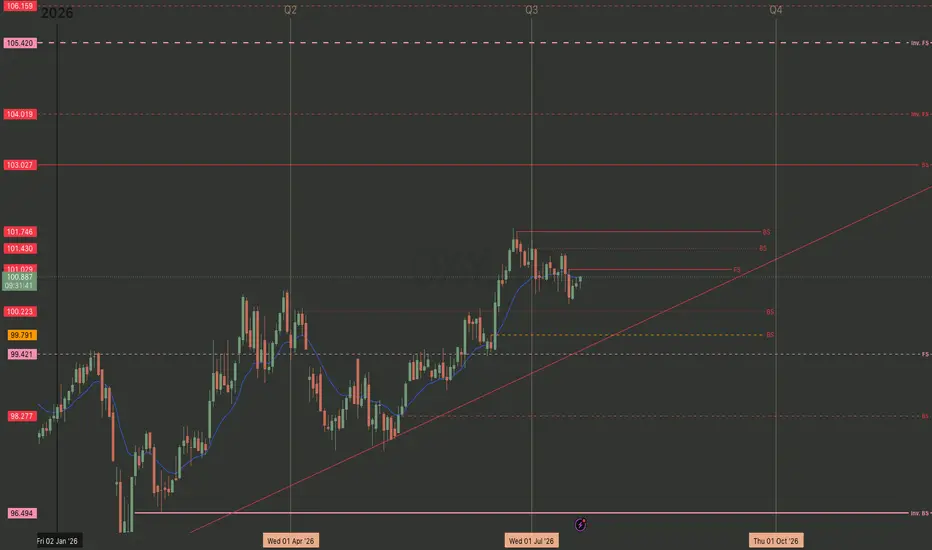
Its good to keep an eye on DXY
A 4hr / daily timeframe accumulation trend created 27 Jan in Q1 & confirmed the first week of May with 5 days using the trend as its support friend. Enough investors in Long pants were able to get some price action above the monthly support at $99.42 resistance and use it as support to keep their accumulation trend going.
price action today is under a daily Frontside candle which is often used as a target so those investors waiting there are R.A.T.S using the support candle as resistance and calling a "Rejection As target" to exit their scalps, abandon the long pant party and put on some shorts.
it all depends if the the Long Pant investors can destroy the R.A.T's or not. If so, they march victoriously to $104 - $105.
If not, then investors in short's take it down to trend and the 4hr BackSide range will be the last hope at $99.791 to support the accumulation trend.
When trends break, price action targets the base of the trend, called the "vertex".
The Vertex of any trend is protected by the BackSide or FrontSide of the range - Support range or Resistance range.
When a BackSide candle or BackSide of the range is tested, price action is expected to show a strong reaction - i.e long wicks to or away from level. big body "engulfing" candles, leaving F.V.G's and creating another vertex for a high angle trend.
The FrontSide of the range shows a more subtle reaction, a low angle trend that ladders slowing in the direction of the trend.
4 candles:
BackSide = Supports high angle trends
FrontSide = Supports low angle trends.
(Inv.BS) Inverse BackSide = Resistance, supports high angle distribution trends. the inverse of the BackSide support Candle
Inv.FS) Inverse FrontSide = Resistance, supports low angle distribution trends. The inverse of the FrontSide support candle.
A Range is 2 or more consecutive candles of the same color. The BackSide candle or Inv.Backside is always the first candle of that range.
The FrontSide or Inverse FS is always the last candle of that range.
4 candles, 4 levels illustrating the structure of the market with a methodical, data driven approach.
If the expectations are not met, then price action is targeting a different range than the one you chose to look at. Opportunities to exit usually present themselves by the same science. Strength favors the higher timeframes.
-----------------------------------
Multiple Time-Frame Analysis; Color Code | Strength favors the higher timeframe.
Yearly timeframe = black
Monthly timeframe = pink
weekly = grey
daily = red
4hr = orange
1hr = yellow
15min = blue
5min = green if they are shown. (Level visibility on intervals is set to timeframe the level was found on and below to keep chart view organized.)
** Candle Science explained **
A Range = two or more consecutive color candles.
There are two types of ranges - accumulation and distribution.
DISTRIBUTION RANGES DEFINED:
When price is above a distribution range, these candles/levels act as support.
(BS) BACKSIDE Candle - First distribution candle in a distribution range. Expectation = strong reaction to price. long wicks reaching to or away from level.
(FS) FrontSide Candle - Last distribution candle in a distribution range. Expectation = reversal, create a trend in the opposite direction. Distribution candles are used as support.
ACCUMULATION RANGES DEFINED: When price is below an accumulation range, these candles/levels act as resistance.
INVERSE BACKSIDE (Inv.BS) - First Accumulation candle in an accumulation range. Expectation. = strong reaction to price. long wicks reaching to or away from level.
INVERSE FRONTSIDE (Inv.FS) - Last accumulation candle in an accumulation range. Expectation = reversal, create a trend in the opposite direction. Accumulation candles are used as resistance.
A 4hr / daily timeframe accumulation trend created 27 Jan in Q1 & confirmed the first week of May with 5 days using the trend as its support friend. Enough investors in Long pants were able to get some price action above the monthly support at $99.42 resistance and use it as support to keep their accumulation trend going.
price action today is under a daily Frontside candle which is often used as a target so those investors waiting there are R.A.T.S using the support candle as resistance and calling a "Rejection As target" to exit their scalps, abandon the long pant party and put on some shorts.
it all depends if the the Long Pant investors can destroy the R.A.T's or not. If so, they march victoriously to $104 - $105.
If not, then investors in short's take it down to trend and the 4hr BackSide range will be the last hope at $99.791 to support the accumulation trend.
When trends break, price action targets the base of the trend, called the "vertex".
The Vertex of any trend is protected by the BackSide or FrontSide of the range - Support range or Resistance range.
When a BackSide candle or BackSide of the range is tested, price action is expected to show a strong reaction - i.e long wicks to or away from level. big body "engulfing" candles, leaving F.V.G's and creating another vertex for a high angle trend.
The FrontSide of the range shows a more subtle reaction, a low angle trend that ladders slowing in the direction of the trend.
4 candles:
BackSide = Supports high angle trends
FrontSide = Supports low angle trends.
(Inv.BS) Inverse BackSide = Resistance, supports high angle distribution trends. the inverse of the BackSide support Candle
Inv.FS) Inverse FrontSide = Resistance, supports low angle distribution trends. The inverse of the FrontSide support candle.
A Range is 2 or more consecutive candles of the same color. The BackSide candle or Inv.Backside is always the first candle of that range.
The FrontSide or Inverse FS is always the last candle of that range.
4 candles, 4 levels illustrating the structure of the market with a methodical, data driven approach.
If the expectations are not met, then price action is targeting a different range than the one you chose to look at. Opportunities to exit usually present themselves by the same science. Strength favors the higher timeframes.
-----------------------------------
Multiple Time-Frame Analysis; Color Code | Strength favors the higher timeframe.
Yearly timeframe = black
Monthly timeframe = pink
weekly = grey
daily = red
4hr = orange
1hr = yellow
15min = blue
5min = green if they are shown. (Level visibility on intervals is set to timeframe the level was found on and below to keep chart view organized.)
** Candle Science explained **
A Range = two or more consecutive color candles.
There are two types of ranges - accumulation and distribution.
DISTRIBUTION RANGES DEFINED:
When price is above a distribution range, these candles/levels act as support.
(BS) BACKSIDE Candle - First distribution candle in a distribution range. Expectation = strong reaction to price. long wicks reaching to or away from level.
(FS) FrontSide Candle - Last distribution candle in a distribution range. Expectation = reversal, create a trend in the opposite direction. Distribution candles are used as support.
ACCUMULATION RANGES DEFINED: When price is below an accumulation range, these candles/levels act as resistance.
INVERSE BACKSIDE (Inv.BS) - First Accumulation candle in an accumulation range. Expectation. = strong reaction to price. long wicks reaching to or away from level.
INVERSE FRONTSIDE (Inv.FS) - Last accumulation candle in an accumulation range. Expectation = reversal, create a trend in the opposite direction. Accumulation candles are used as resistance.

คำจำกัดสิทธิ์ความรับผิดชอบ
ข้อมูลและบทความไม่ได้มีวัตถุประสงค์เพื่อก่อให้เกิดกิจกรรมทางการเงิน, การลงทุน, การซื้อขาย, ข้อเสนอแนะ หรือคำแนะนำประเภทอื่น ๆ ที่ให้หรือรับรองโดย TradingView อ่านเพิ่มเติมใน ข้อกำหนดการใช้งาน
คำจำกัดสิทธิ์ความรับผิดชอบ
ข้อมูลและบทความไม่ได้มีวัตถุประสงค์เพื่อก่อให้เกิดกิจกรรมทางการเงิน, การลงทุน, การซื้อขาย, ข้อเสนอแนะ หรือคำแนะนำประเภทอื่น ๆ ที่ให้หรือรับรองโดย TradingView อ่านเพิ่มเติมใน ข้อกำหนดการใช้งาน