
Market Context & Structural Overview
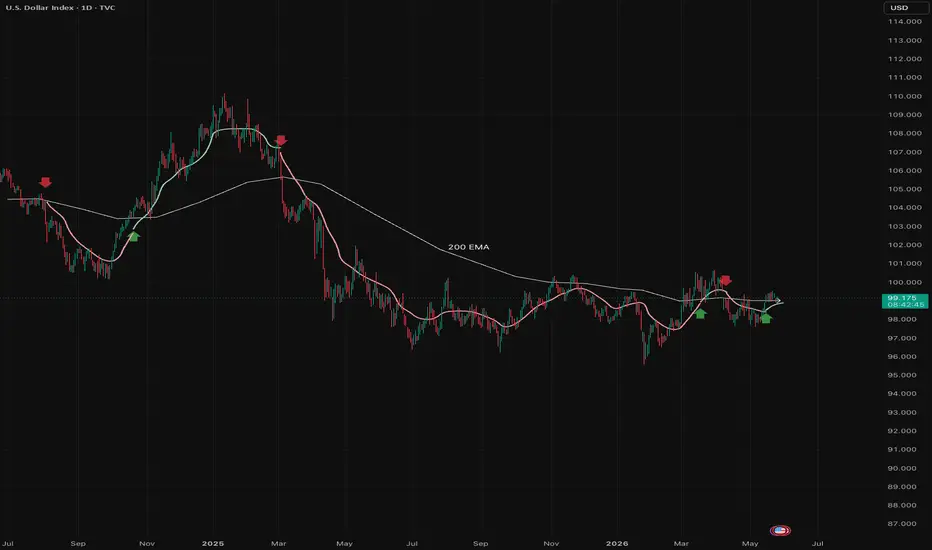
Looking at the U.S. Dollar Index (DXY) on the daily horizon, price action is currently undergoing a significant technical regime shift. This chart analysis highlights the transition from a long-term bearish distribution phase into a potential accumulation model, using standard quantitative volatility boundaries and moving average filters.
Technical Breakdown & Chart Elements:
The 200-Period Baseline (Thick White Line): This major exponential moving average serves as the primary macro trend filter. Throughout the entire structural decline in 2025, price action remained strictly capped below this dynamic resistance, confirming a persistent bearish market environment and filtering out premature counter-trend long attempts.
The Dynamic Trail & Momentum Ribbon: The adaptive trailing line acts as a localized structural support/resistance boundary. During the sustained markdown phase, the ribbon maintained a clear bearish posture, tracking the trend velocity without getting chopped up by minor technical pullbacks.
The Current Structural Shift (May 2026):
We are currently witnessing a crucial confluence of technical events. Price has successfully crossed and sustained above the 200-EMA baseline for the first time in months. Concurrently, the technical trend metrics have shifted to a BULLISH reading.
While the underlying trend intensity is currently classified as low/sideways (indicating an early breakout or re-accumulation phase), the recent clustering of technical demand triggers near the $98.840 zone establishes a strong structural floor.
Trading Outlook:
As long as the DXY maintains its structure above the key pivot area between $98.840 and $98.999, the medium-term bias shifts from bearish to constructive. A confirmed breakout past the recent local highs would validate this institutional accumulation model.
Major Support Invalidation: $98.840
Current Price Reference: $99.149
Technical Bias: Bullish Accumulation / Regime Change
Looking at the U.S. Dollar Index (DXY) on the daily horizon, price action is currently undergoing a significant technical regime shift. This chart analysis highlights the transition from a long-term bearish distribution phase into a potential accumulation model, using standard quantitative volatility boundaries and moving average filters.
Technical Breakdown & Chart Elements:
The 200-Period Baseline (Thick White Line): This major exponential moving average serves as the primary macro trend filter. Throughout the entire structural decline in 2025, price action remained strictly capped below this dynamic resistance, confirming a persistent bearish market environment and filtering out premature counter-trend long attempts.
The Dynamic Trail & Momentum Ribbon: The adaptive trailing line acts as a localized structural support/resistance boundary. During the sustained markdown phase, the ribbon maintained a clear bearish posture, tracking the trend velocity without getting chopped up by minor technical pullbacks.
The Current Structural Shift (May 2026):
We are currently witnessing a crucial confluence of technical events. Price has successfully crossed and sustained above the 200-EMA baseline for the first time in months. Concurrently, the technical trend metrics have shifted to a BULLISH reading.
While the underlying trend intensity is currently classified as low/sideways (indicating an early breakout or re-accumulation phase), the recent clustering of technical demand triggers near the $98.840 zone establishes a strong structural floor.
Trading Outlook:
As long as the DXY maintains its structure above the key pivot area between $98.840 and $98.999, the medium-term bias shifts from bearish to constructive. A confirmed breakout past the recent local highs would validate this institutional accumulation model.
Major Support Invalidation: $98.840
Current Price Reference: $99.149
Technical Bias: Bullish Accumulation / Regime Change

CH Invest and Trading
คำจำกัดสิทธิ์ความรับผิดชอบ
ข้อมูลและบทความไม่ได้มีวัตถุประสงค์เพื่อก่อให้เกิดกิจกรรมทางการเงิน, การลงทุน, การซื้อขาย, ข้อเสนอแนะ หรือคำแนะนำประเภทอื่น ๆ ที่ให้หรือรับรองโดย TradingView อ่านเพิ่มเติมใน ข้อกำหนดการใช้งาน
CH Invest and Trading
คำจำกัดสิทธิ์ความรับผิดชอบ
ข้อมูลและบทความไม่ได้มีวัตถุประสงค์เพื่อก่อให้เกิดกิจกรรมทางการเงิน, การลงทุน, การซื้อขาย, ข้อเสนอแนะ หรือคำแนะนำประเภทอื่น ๆ ที่ให้หรือรับรองโดย TradingView อ่านเพิ่มเติมใน ข้อกำหนดการใช้งาน