
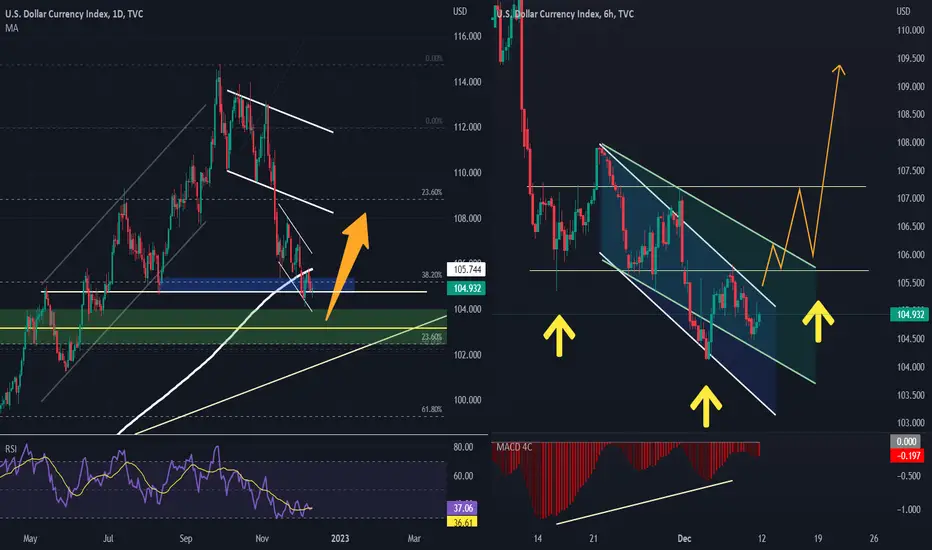
On the daily chart, The DXY holds in a powerful resistance zone; there is a 200DMA, monthly resistance, weekly resistance, and a supply zone with a 38.20 Fib.
In the 6-hour time frame, we have two reversal patterns, with a divergence in the MACD.
We may see a head and shoulders pattern if a candle closes above 105.74, as shown by the yellow arrows on the hourly chart.
--------------------------------
Feel free to share your thoughts in the comments, and kindly support the idea with a like. Your support is greatly appreciated!
In the 6-hour time frame, we have two reversal patterns, with a divergence in the MACD.
We may see a head and shoulders pattern if a candle closes above 105.74, as shown by the yellow arrows on the hourly chart.
--------------------------------
Feel free to share your thoughts in the comments, and kindly support the idea with a like. Your support is greatly appreciated!

การนำเสนอที่เกี่ยวข้อง
คำจำกัดสิทธิ์ความรับผิดชอบ
ข้อมูลและบทความไม่ได้มีวัตถุประสงค์เพื่อก่อให้เกิดกิจกรรมทางการเงิน, การลงทุน, การซื้อขาย, ข้อเสนอแนะ หรือคำแนะนำประเภทอื่น ๆ ที่ให้หรือรับรองโดย TradingView อ่านเพิ่มเติมใน ข้อกำหนดการใช้งาน
การนำเสนอที่เกี่ยวข้อง
คำจำกัดสิทธิ์ความรับผิดชอบ
ข้อมูลและบทความไม่ได้มีวัตถุประสงค์เพื่อก่อให้เกิดกิจกรรมทางการเงิน, การลงทุน, การซื้อขาย, ข้อเสนอแนะ หรือคำแนะนำประเภทอื่น ๆ ที่ให้หรือรับรองโดย TradingView อ่านเพิ่มเติมใน ข้อกำหนดการใช้งาน