
Summary:
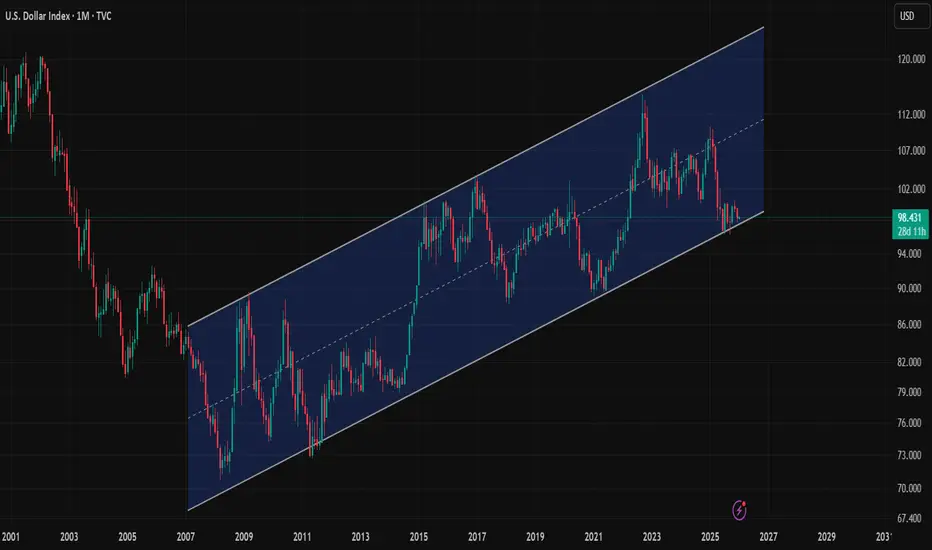
The U.S. Dollar Index (DXY) is testing the lower boundary of a multi-year ascending channel on the monthly chart, making this a high-importance area for trend continuation or a larger breakdown.
Technical Reasoning:
Trend: Price has respected a clear rising channel since ~2007, with higher highs and higher lows over the long term.
Structure: DXY is now sitting right at channel support, a level that previously acted as a strong demand zone.
Price Action: Recent monthly candles show deceleration and consolidation, suggesting sellers are losing momentum but buyers haven’t fully stepped in yet.
Mean Reversion: Price is below the channel midline, increasing the probability of a bounce toward the median if support holds.
Invalidation Risk: A clean monthly close below the channel would be the first structural breakdown of this long-term trend.
Fundamental Context:
Markets are increasingly pricing in Fed rate cuts and looser monetary policy, which has weighed on the dollar. However, persistent inflation risks or renewed risk-off sentiment could quickly restore USD demand from this support zone.
Key Levels to Watch:
Major Support: 97.50 – 98.00 (channel base / long-term demand)
Immediate Resistance: 101.50 – 102.50
Mid-Channel Target: 105.00 – 106.00
Bearish Breakdown Target: 94.00 → 90.00 (if monthly support fails)
Takeaway:
📌 Bullish bias as long as DXY holds above 97.50 on a monthly closing basis, targeting a move back toward the channel midline.
⚠️ Bearish shift only if we see a decisive monthly close below the channel, opening the door for a deeper structural decline.
#DXY #USD #Forex #Macro #TechnicalAnalysis #TradingView
The U.S. Dollar Index (DXY) is testing the lower boundary of a multi-year ascending channel on the monthly chart, making this a high-importance area for trend continuation or a larger breakdown.
Technical Reasoning:
Trend: Price has respected a clear rising channel since ~2007, with higher highs and higher lows over the long term.
Structure: DXY is now sitting right at channel support, a level that previously acted as a strong demand zone.
Price Action: Recent monthly candles show deceleration and consolidation, suggesting sellers are losing momentum but buyers haven’t fully stepped in yet.
Mean Reversion: Price is below the channel midline, increasing the probability of a bounce toward the median if support holds.
Invalidation Risk: A clean monthly close below the channel would be the first structural breakdown of this long-term trend.
Fundamental Context:
Markets are increasingly pricing in Fed rate cuts and looser monetary policy, which has weighed on the dollar. However, persistent inflation risks or renewed risk-off sentiment could quickly restore USD demand from this support zone.
Key Levels to Watch:
Major Support: 97.50 – 98.00 (channel base / long-term demand)
Immediate Resistance: 101.50 – 102.50
Mid-Channel Target: 105.00 – 106.00
Bearish Breakdown Target: 94.00 → 90.00 (if monthly support fails)
Takeaway:
📌 Bullish bias as long as DXY holds above 97.50 on a monthly closing basis, targeting a move back toward the channel midline.
⚠️ Bearish shift only if we see a decisive monthly close below the channel, opening the door for a deeper structural decline.
#DXY #USD #Forex #Macro #TechnicalAnalysis #TradingView

คำจำกัดสิทธิ์ความรับผิดชอบ
ข้อมูลและบทความไม่ได้มีวัตถุประสงค์เพื่อก่อให้เกิดกิจกรรมทางการเงิน, การลงทุน, การซื้อขาย, ข้อเสนอแนะ หรือคำแนะนำประเภทอื่น ๆ ที่ให้หรือรับรองโดย TradingView อ่านเพิ่มเติมใน ข้อกำหนดการใช้งาน
คำจำกัดสิทธิ์ความรับผิดชอบ
ข้อมูลและบทความไม่ได้มีวัตถุประสงค์เพื่อก่อให้เกิดกิจกรรมทางการเงิน, การลงทุน, การซื้อขาย, ข้อเสนอแนะ หรือคำแนะนำประเภทอื่น ๆ ที่ให้หรือรับรองโดย TradingView อ่านเพิ่มเติมใน ข้อกำหนดการใช้งาน