
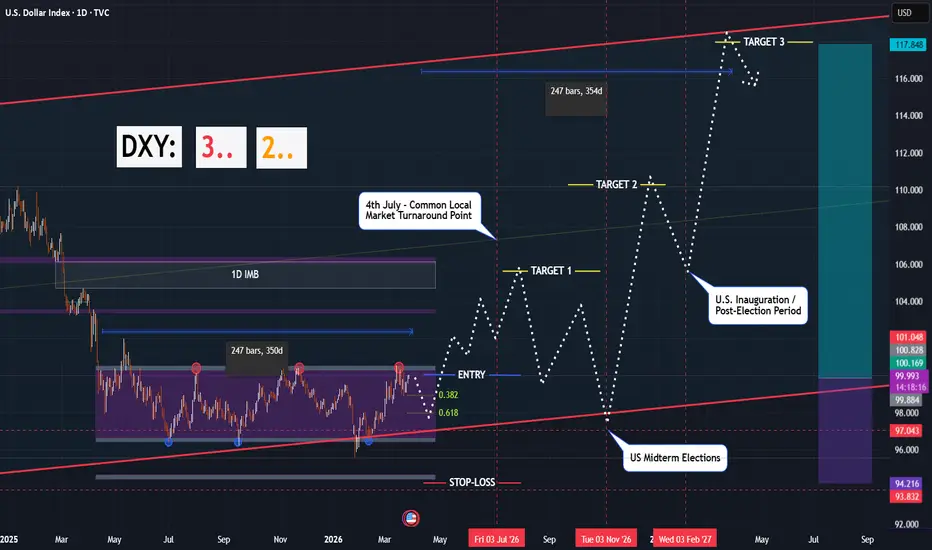
Tick Tock... Can you hear that? The clock is ticking down. DXY is sitting at the last stage of consolidation, and all that's left is to pull the trigger. Destination: Stratosphere.
# - - - - -
Technicals:
1. [RED PARALLEL LINES]: The price has been consolidating above the bottom Support Line of the Long-Term Global Ascending Trend Channel for 350 days as of today. This price behavior suggests that the market may have found a global bottom, indicating that institutional capital is accumulating USD.
2. [Gray boundaries and red/blue circles]: The horizontal accumulation channel [$96.46, $100.32] at resistance/support levels has formed dense order clusters and contains an enormous amount of volume. This range will act as a spring, potentially catapulting the price once it breaks through either the upper or lower boundary..
3. [Orientation]: The psychological mark of $100.00 plays only the orientation role, the more important point is that, taking into account the repeatedly retest of $100.00 mark as bulls are sticking to it from below, the potential upward breakthrough move will be fueled by hunting the numerous stop-losses above the $100.00 and up to $103.50, which have been set by traders who traded all the time in the channel range.
4. [Price Targets]: If price passes through the next target will be:
- the 1D Imbalance zone [$104.74, $106.12],
- the local High at $110.00 and
- the Upper Boundary of Long-term Trend Channel between $118.00 and $122.00
5. [Timely Targets]: The main targets in time for this 12-15 month long trend are:
- The 250th Anniversary of US Independence (July 4, 2026, and the following 2–3 weeks).;
- The US Midterm Elections (on and around November 3, 2026);
- The US Inauguration and post-election period, coinciding with the 2026 Annual Corporate Reporting season (throughout February 2027);
- Projected turnaround point for Wave 3 (End of March 2027).
# - - - - -
Conclusion:
That being said, the probability of the near-term upward movement for USD is very HIGH.
Note: Before the price brakes above, in worst case there could still be a retest of 0.618 Fibo or even the retest of bottom support at $97.40. So be aware.
# - - - - -
Long-Term LONG SETUP:
✅ Entry Point 1 [High Risk]: Market
✅ Entry Point 2 [MAIN]: TRIGGER Above $100.70
🛑 Stop-Loss: $94.20
🤑 Target 1: $105.70
🤑 Target 2: $110.37
🤑 Target 3: $117.97
🕒 Timeframe: 15 months
The scenario will be invalidated if we see a strong close of 1D candle below $95.30.
# - - - - -
Good Luck! ☺️
# - - - - -
DISCLAIMER: Not financial advice. Everyone must make trading decisions at their own risk, guided only by their own criteria and strategy for opening or not opening a trade.
# - - - - -
P.S. Check out my other DXY analyses in Related Publications on the right >>>
P.P.S Follow me to stay updated on this and others setups
# - - - - -
Technicals:
1. [RED PARALLEL LINES]: The price has been consolidating above the bottom Support Line of the Long-Term Global Ascending Trend Channel for 350 days as of today. This price behavior suggests that the market may have found a global bottom, indicating that institutional capital is accumulating USD.
2. [Gray boundaries and red/blue circles]: The horizontal accumulation channel [$96.46, $100.32] at resistance/support levels has formed dense order clusters and contains an enormous amount of volume. This range will act as a spring, potentially catapulting the price once it breaks through either the upper or lower boundary..
3. [Orientation]: The psychological mark of $100.00 plays only the orientation role, the more important point is that, taking into account the repeatedly retest of $100.00 mark as bulls are sticking to it from below, the potential upward breakthrough move will be fueled by hunting the numerous stop-losses above the $100.00 and up to $103.50, which have been set by traders who traded all the time in the channel range.
4. [Price Targets]: If price passes through the next target will be:
- the 1D Imbalance zone [$104.74, $106.12],
- the local High at $110.00 and
- the Upper Boundary of Long-term Trend Channel between $118.00 and $122.00
5. [Timely Targets]: The main targets in time for this 12-15 month long trend are:
- The 250th Anniversary of US Independence (July 4, 2026, and the following 2–3 weeks).;
- The US Midterm Elections (on and around November 3, 2026);
- The US Inauguration and post-election period, coinciding with the 2026 Annual Corporate Reporting season (throughout February 2027);
- Projected turnaround point for Wave 3 (End of March 2027).
# - - - - -
Conclusion:
That being said, the probability of the near-term upward movement for USD is very HIGH.
Note: Before the price brakes above, in worst case there could still be a retest of 0.618 Fibo or even the retest of bottom support at $97.40. So be aware.
# - - - - -
Long-Term LONG SETUP:
✅ Entry Point 1 [High Risk]: Market
✅ Entry Point 2 [MAIN]: TRIGGER Above $100.70
🛑 Stop-Loss: $94.20
🤑 Target 1: $105.70
🤑 Target 2: $110.37
🤑 Target 3: $117.97
🕒 Timeframe: 15 months
The scenario will be invalidated if we see a strong close of 1D candle below $95.30.
# - - - - -
Good Luck! ☺️
# - - - - -
DISCLAIMER: Not financial advice. Everyone must make trading decisions at their own risk, guided only by their own criteria and strategy for opening or not opening a trade.
# - - - - -
P.S. Check out my other DXY analyses in Related Publications on the right >>>
P.P.S Follow me to stay updated on this and others setups
การซื้อขายยังคงดำเนินอยู่

Visit my Risk Enforcement App → mywarner.app/
Follow me on Telegram → t.me/totsamiykaa
Watch me on YT → youtube.com/@totsamiykaa
See me on Threads → threads.com/@totsamiykaa
Follow me on Telegram → t.me/totsamiykaa
Watch me on YT → youtube.com/@totsamiykaa
See me on Threads → threads.com/@totsamiykaa
การนำเสนอที่เกี่ยวข้อง
คำจำกัดสิทธิ์ความรับผิดชอบ
ข้อมูลและบทความไม่ได้มีวัตถุประสงค์เพื่อก่อให้เกิดกิจกรรมทางการเงิน, การลงทุน, การซื้อขาย, ข้อเสนอแนะ หรือคำแนะนำประเภทอื่น ๆ ที่ให้หรือรับรองโดย TradingView อ่านเพิ่มเติมใน ข้อกำหนดการใช้งาน
Visit my Risk Enforcement App → mywarner.app/
Follow me on Telegram → t.me/totsamiykaa
Watch me on YT → youtube.com/@totsamiykaa
See me on Threads → threads.com/@totsamiykaa
Follow me on Telegram → t.me/totsamiykaa
Watch me on YT → youtube.com/@totsamiykaa
See me on Threads → threads.com/@totsamiykaa
การนำเสนอที่เกี่ยวข้อง
คำจำกัดสิทธิ์ความรับผิดชอบ
ข้อมูลและบทความไม่ได้มีวัตถุประสงค์เพื่อก่อให้เกิดกิจกรรมทางการเงิน, การลงทุน, การซื้อขาย, ข้อเสนอแนะ หรือคำแนะนำประเภทอื่น ๆ ที่ให้หรือรับรองโดย TradingView อ่านเพิ่มเติมใน ข้อกำหนดการใช้งาน