
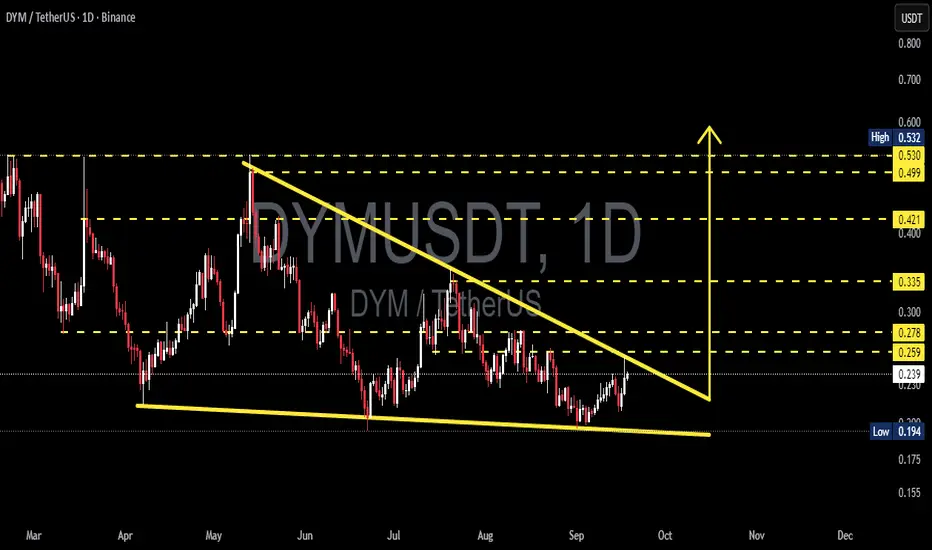
Technical Analysis (Daily Timeframe):
The price action of DYM/USDT has been forming a falling wedge / descending structure over the past few months. This setup shows sustained downward pressure with a descending resistance line, while the support area around 0.194–0.200 continues to hold firmly.
Typically, this kind of structure ends with a strong move, either a bullish breakout or a bearish breakdown — making the current zone a critical decision point.
---
🔎 Key Levels & Pattern Details
Major Support: 0.194 (multi-tested historical low).
Current Zone: ~0.239, right under the descending resistance line.
First Breakout Zone (confirmation needed): 0.259 – 0.278.
Next Resistance Levels (targets after breakout):
0.335 → initial breakout target.
0.421 → mid-term target.
0.499 – 0.532 → strong supply zone & major resistance.
---
🚀 Bullish Scenario
1. A valid breakout requires a daily close above 0.259–0.278 with strong volume.
2. A successful retest of the breakout zone would provide additional confirmation.
3. Bullish Targets:
Target 1: 0.335.
Target 2: 0.421.
Target 3: 0.499 – 0.532.
4. Invalidation: if price loses 0.194 support.
Note: Falling wedge is often considered a bullish reversal pattern, so probability of upside increases with a confirmed breakout.
---
🐻 Bearish Scenario
1. If the price rejects at the descending resistance, consolidation may continue.
2. A daily close below 0.194 would confirm breakdown, opening room for deeper downside.
3. Potential downside targets: first re-test of 0.194, then further extension to lower levels (likely around 0.150–0.160 based on weekly structure).
4. Stop-loss for short setups can be placed above 0.278.
---
📌 Additional Insights
The wedge has been developing since May 2025 — the longer the consolidation, the more explosive the next move can be.
Watch volume & momentum indicators (RSI/MACD) for breakout validation.
For conservative traders, waiting for a confirmed breakout/breakdown is safer than entering mid-range.
---
📝 Conclusion
DYM/USDT is approaching a major turning point. A confirmed breakout above 0.259–0.278 could open a rally towards 0.335, 0.421, and even 0.532. On the other hand, a breakdown below 0.194 would confirm bearish continuation.
Patience and strict risk management are key, as this structure can deliver a significant move after months of tightening price action.
---
#DYM #DYMUSDT #Crypto #Altcoin #TechnicalAnalysis #PriceAction #FallingWedge #Breakout #BullishScenario #BearishScenario
The price action of DYM/USDT has been forming a falling wedge / descending structure over the past few months. This setup shows sustained downward pressure with a descending resistance line, while the support area around 0.194–0.200 continues to hold firmly.
Typically, this kind of structure ends with a strong move, either a bullish breakout or a bearish breakdown — making the current zone a critical decision point.
---
🔎 Key Levels & Pattern Details
Major Support: 0.194 (multi-tested historical low).
Current Zone: ~0.239, right under the descending resistance line.
First Breakout Zone (confirmation needed): 0.259 – 0.278.
Next Resistance Levels (targets after breakout):
0.335 → initial breakout target.
0.421 → mid-term target.
0.499 – 0.532 → strong supply zone & major resistance.
---
🚀 Bullish Scenario
1. A valid breakout requires a daily close above 0.259–0.278 with strong volume.
2. A successful retest of the breakout zone would provide additional confirmation.
3. Bullish Targets:
Target 1: 0.335.
Target 2: 0.421.
Target 3: 0.499 – 0.532.
4. Invalidation: if price loses 0.194 support.
Note: Falling wedge is often considered a bullish reversal pattern, so probability of upside increases with a confirmed breakout.
---
🐻 Bearish Scenario
1. If the price rejects at the descending resistance, consolidation may continue.
2. A daily close below 0.194 would confirm breakdown, opening room for deeper downside.
3. Potential downside targets: first re-test of 0.194, then further extension to lower levels (likely around 0.150–0.160 based on weekly structure).
4. Stop-loss for short setups can be placed above 0.278.
---
📌 Additional Insights
The wedge has been developing since May 2025 — the longer the consolidation, the more explosive the next move can be.
Watch volume & momentum indicators (RSI/MACD) for breakout validation.
For conservative traders, waiting for a confirmed breakout/breakdown is safer than entering mid-range.
---
📝 Conclusion
DYM/USDT is approaching a major turning point. A confirmed breakout above 0.259–0.278 could open a rally towards 0.335, 0.421, and even 0.532. On the other hand, a breakdown below 0.194 would confirm bearish continuation.
Patience and strict risk management are key, as this structure can deliver a significant move after months of tightening price action.
---
#DYM #DYMUSDT #Crypto #Altcoin #TechnicalAnalysis #PriceAction #FallingWedge #Breakout #BullishScenario #BearishScenario

✅ Get Free Signals! Join Our Telegram Channel Here: t.me/TheCryptoNuclear
✅ Twitter: twitter.com/crypto_nuclear
✅ Join Bybit : partner.bybit.com/b/nuclearvip
✅ Benefits : Lifetime Trading Fee Discount -50%
✅ Twitter: twitter.com/crypto_nuclear
✅ Join Bybit : partner.bybit.com/b/nuclearvip
✅ Benefits : Lifetime Trading Fee Discount -50%
คำจำกัดสิทธิ์ความรับผิดชอบ
ข้อมูลและบทความไม่ได้มีวัตถุประสงค์เพื่อก่อให้เกิดกิจกรรมทางการเงิน, การลงทุน, การซื้อขาย, ข้อเสนอแนะ หรือคำแนะนำประเภทอื่น ๆ ที่ให้หรือรับรองโดย TradingView อ่านเพิ่มเติมใน ข้อกำหนดการใช้งาน
✅ Get Free Signals! Join Our Telegram Channel Here: t.me/TheCryptoNuclear
✅ Twitter: twitter.com/crypto_nuclear
✅ Join Bybit : partner.bybit.com/b/nuclearvip
✅ Benefits : Lifetime Trading Fee Discount -50%
✅ Twitter: twitter.com/crypto_nuclear
✅ Join Bybit : partner.bybit.com/b/nuclearvip
✅ Benefits : Lifetime Trading Fee Discount -50%
คำจำกัดสิทธิ์ความรับผิดชอบ
ข้อมูลและบทความไม่ได้มีวัตถุประสงค์เพื่อก่อให้เกิดกิจกรรมทางการเงิน, การลงทุน, การซื้อขาย, ข้อเสนอแนะ หรือคำแนะนำประเภทอื่น ๆ ที่ให้หรือรับรองโดย TradingView อ่านเพิ่มเติมใน ข้อกำหนดการใช้งาน