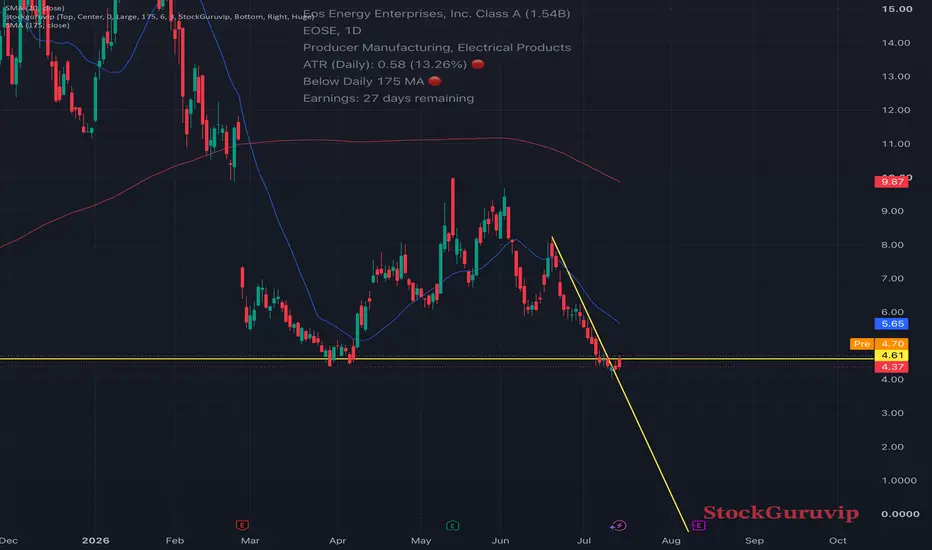
The  EOSE chart shows a breakout from a falling resistance line that ended with a hammer candle, indicating a potential reversal. The support line, marked in yellow, is now being tested. If this line holds, it would confirm the uptrend and provide a good buying opportunity. However, if the price breaks below this line, it could lead to further downward movement. The reasoning behind this setup is that a break above the resistance line and a hold above the support line would indicate a change in market sentiment, making this a potentially profitable trade.
Not financial advice.
EOSE chart shows a breakout from a falling resistance line that ended with a hammer candle, indicating a potential reversal. The support line, marked in yellow, is now being tested. If this line holds, it would confirm the uptrend and provide a good buying opportunity. However, if the price breaks below this line, it could lead to further downward movement. The reasoning behind this setup is that a break above the resistance line and a hold above the support line would indicate a change in market sentiment, making this a potentially profitable trade. Not financial advice.

stockgurvip
คำจำกัดสิทธิ์ความรับผิดชอบ
ข้อมูลและบทความไม่ได้มีวัตถุประสงค์เพื่อก่อให้เกิดกิจกรรมทางการเงิน, การลงทุน, การซื้อขาย, ข้อเสนอแนะ หรือคำแนะนำประเภทอื่น ๆ ที่ให้หรือรับรองโดย TradingView อ่านเพิ่มเติมใน ข้อกำหนดการใช้งาน
stockgurvip
คำจำกัดสิทธิ์ความรับผิดชอบ
ข้อมูลและบทความไม่ได้มีวัตถุประสงค์เพื่อก่อให้เกิดกิจกรรมทางการเงิน, การลงทุน, การซื้อขาย, ข้อเสนอแนะ หรือคำแนะนำประเภทอื่น ๆ ที่ให้หรือรับรองโดย TradingView อ่านเพิ่มเติมใน ข้อกำหนดการใช้งาน