
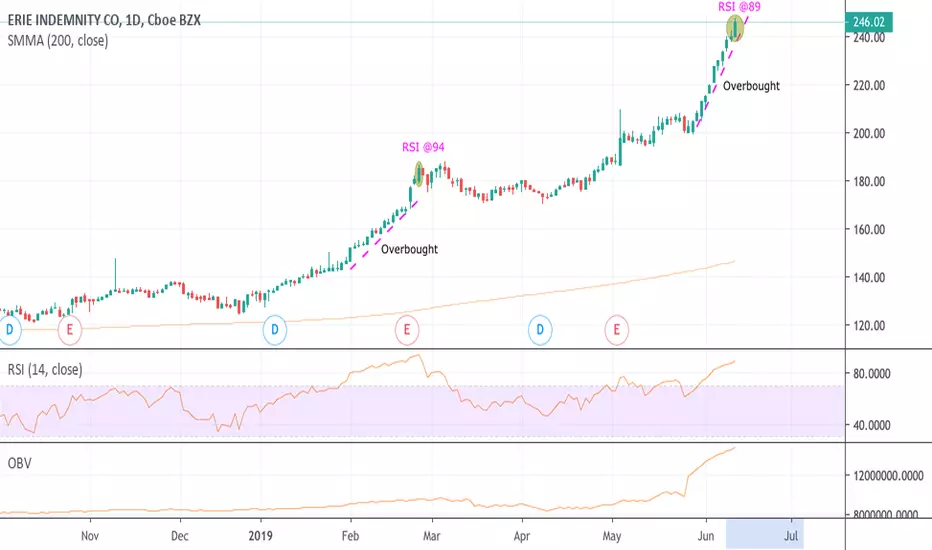
I haven't seen a chart like this.
Overbought conditions tend to go to extremely high levels. ( RSI<30 oversold & RSI>70 overbought).
Technical Analysis:
I see a positive divergence between the bull rally from February (marked in the chart) and this June bull rally, is that the OBV is 50% higher!
RSI(10) 89, last rally ended on RSI(10) @94.
Check out the chart for more information.
Overbought conditions tend to go to extremely high levels. ( RSI<30 oversold & RSI>70 overbought).
Technical Analysis:
I see a positive divergence between the bull rally from February (marked in the chart) and this June bull rally, is that the OBV is 50% higher!
RSI(10) 89, last rally ended on RSI(10) @94.
Check out the chart for more information.

คำจำกัดสิทธิ์ความรับผิดชอบ
ข้อมูลและบทความไม่ได้มีวัตถุประสงค์เพื่อก่อให้เกิดกิจกรรมทางการเงิน, การลงทุน, การซื้อขาย, ข้อเสนอแนะ หรือคำแนะนำประเภทอื่น ๆ ที่ให้หรือรับรองโดย TradingView อ่านเพิ่มเติมใน ข้อกำหนดการใช้งาน
คำจำกัดสิทธิ์ความรับผิดชอบ
ข้อมูลและบทความไม่ได้มีวัตถุประสงค์เพื่อก่อให้เกิดกิจกรรมทางการเงิน, การลงทุน, การซื้อขาย, ข้อเสนอแนะ หรือคำแนะนำประเภทอื่น ๆ ที่ให้หรือรับรองโดย TradingView อ่านเพิ่มเติมใน ข้อกำหนดการใช้งาน